Fatigue life by nominal stress method
1. General
1.1. The nominal stress method
The design lifetime is predicted by the nominal stress method, according to EN 1993-1-9: 2005, as:
\[\Delta \sigma_{E,2}=\sigma_{max}-\sigma_{min}\]
\[\Delta \sigma_R=\gamma_{F1} \sigma_{E,2}\]
\[N_R=N_c\sigma_c^m / \Delta \sigma_R^m\]
where:
- \(\sigma_{max},\,\sigma_{min}\) – extreme values of stress
- \(\Delta \sigma_{E,2}\) – characteristic value of nominal stress range
- \(\gamma_{F1}\) – partial safety factor, for these calculations \(\gamma_{F1}=1.15\)
- \(\Delta \sigma_R\) – design value of nominal stress range
- \(N_c\) – reference endurance, for all calculations \(N_c=2\cdot 10^6\)
- \(\sigma_c\) – reference value of the fatigue strength taken from Tab. 8.1–8.10 in EN 1993-1-9:2005
- \(m\) – slope of fatigue strength curve, for all calculations \(m=3\)
1.2. Stress by the analytical model
The stress calculated from the load combination is obtained by:
\[\sigma_i=F_i/A\]
where:
- \(F_i\) – extreme value of axial force
- \(A\) – cross-sectional area of a plate
1.3. Numerical model
The FEM models are prepared in Ansys 19.1 using solid element No. 181. The mesh size is \(0.4t \times 0.4t\). The CBFEM models are made in IDEA StatiCa version 22.1 by four node shell elements. Default mesh settings are used, the minimal mesh size is 10 mm, maximal is 50 mm.
2. A cruciform joint with a transverse fillet weld
2.1. Description
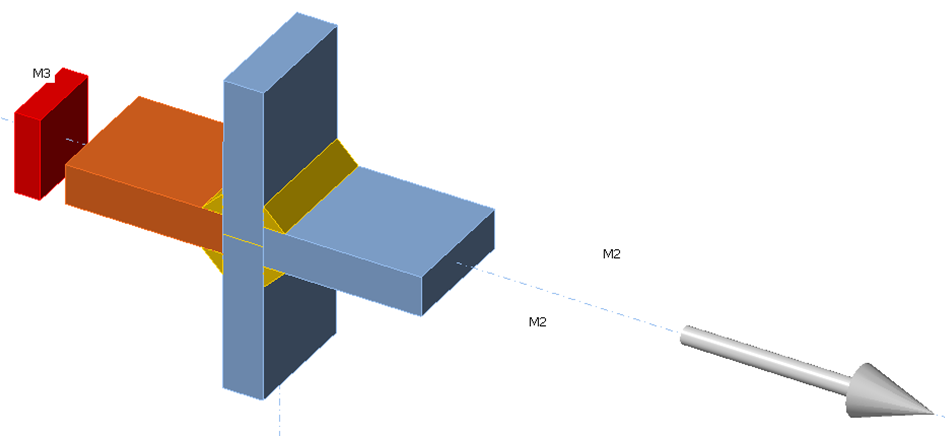
A welded cruciform joint of three plates is created by fillet welds with a throat thickness of 6 mm. Plate dimensions are 50x16 mm, made of steel grade S450; see Fig. 1. The joint is loaded by tensile force.
Fig. 1: Welded cruciform joint
This joint is according to Tab. 8.5 in EN 1993-1-9:2005 construction detail 1. The detail category for \(l=\textrm{thickness of plate}+2\times \textrm{thickness of weld}= 28\, \textrm{mm}\), i.e. \(l<50\,\textrm{mm}\), is 80.
2.2. Analytical model
For this joint, the cross-sectional area of the plate is \(A=50\cdot 16=800\, \textrm{mm}^2\). The results of the analytical model are given in Tab. 1.
Tab. 1: Results of analytical solution AM
| \(F_{max}\) | \(F_{min}\) | \(\sigma_{max}\) | \(\sigma_{min}\) | \(\Delta \sigma_{E,2}\) | \(\Delta \sigma_R\) | \(N_R\) |
| [kN] | [kN] | [MPa] | [MPa] | [MPa] | [MPa] | [-] |
| 85.3 | 8.53 | 106.7 | 10.7 | 96 | 110.4 | 7.61E+05 |
| 105.8 | 10.58 | 132.2 | 13.2 | 119 | 136.9 | 4E+05 |
| 127.1 | 12.71 | 158.9 | 15.9 | 143 | 164.5 | 2.3E+05 |
| 148.4 | 14.84 | 185.6 | 18.6 | 167 | 192.1 | 1.45E+05 |
| 169.8 | 17 | 212.2 | 21.2 | 191 | 219.7 | 9.66E+04 |
2.3. Numerical models
Fatigue sections are created using weld sections at a distance from the weld toe to avoid the influence of peak stress from local weld geometry (\(4t=64 \, \textrm{mm} \ge \textrm{width} = 50\, \textrm{mm}\)). The results of the numerical solution using FEM and CBFEM are shown in Tab. 2 and 3.
Tab. 2. Results of the numerical solution – FEM
| \(F_{max}\) | \(F_{min}\) | \(\sigma_{max}\) | \(\sigma_{min}\) | \(\Delta \sigma_{E,2}\) | \(\Delta \sigma_R\) | \(N_R\) |
| [kN] | [kN] | [MPa] | [MPa] | [MPa] | [MPa] | [-] |
| 85.3 | 8.53 | 106.8 | 10.7 | 96.1 | 110.6 | 7.58E+05 |
| 105.8 | 10.58 | 132.6 | 13.3 | 119.3 | 137.2 | 3.96E+05 |
| 127.1 | 12.71 | 159.3 | 15.9 | 143.4 | 164.9 | 2.28E+05 |
| 148.4 | 14.84 | 185.5 | 18.6 | 166.9 | 192 | 1.45E+05 |
| 169.8 | 17 | 212.1 | 21.2 | 190.9 | 219.6 | 9.67E+04 |
Tab. 3. Results of the numerical solution – CBFEM
| \(F_{max}\) | \(F_{min}\) | \(\sigma_{max}\) | \(\sigma_{min}\) | \(\Delta \sigma_{E,2}\) | \(\Delta \sigma_R\) | \(N_R\) |
| [kN] | [kN] | [MPa] | [MPa] | [MPa] | [MPa] | [-] |
| 85.3 | 8.53 | 108.7 | 10.9 | 97.8 | 112.5 | 7.2E+05 |
| 105.8 | 10.58 | 134.7 | 13.5 | 121.2 | 139.4 | 3.78E+05 |
| 127.1 | 12.71 | 161.9 | 16.2 | 145.7 | 167.6 | 2.18E+05 |
| 148.4 | 14.84 | 189.1 | 18.9 | 170.2 | 195.7 | 1.37E+05 |
| 169.8 | 17 | 216 | 21.6 | 194.4 | 223.6 | 9.16E+04 |
2.4. Verification
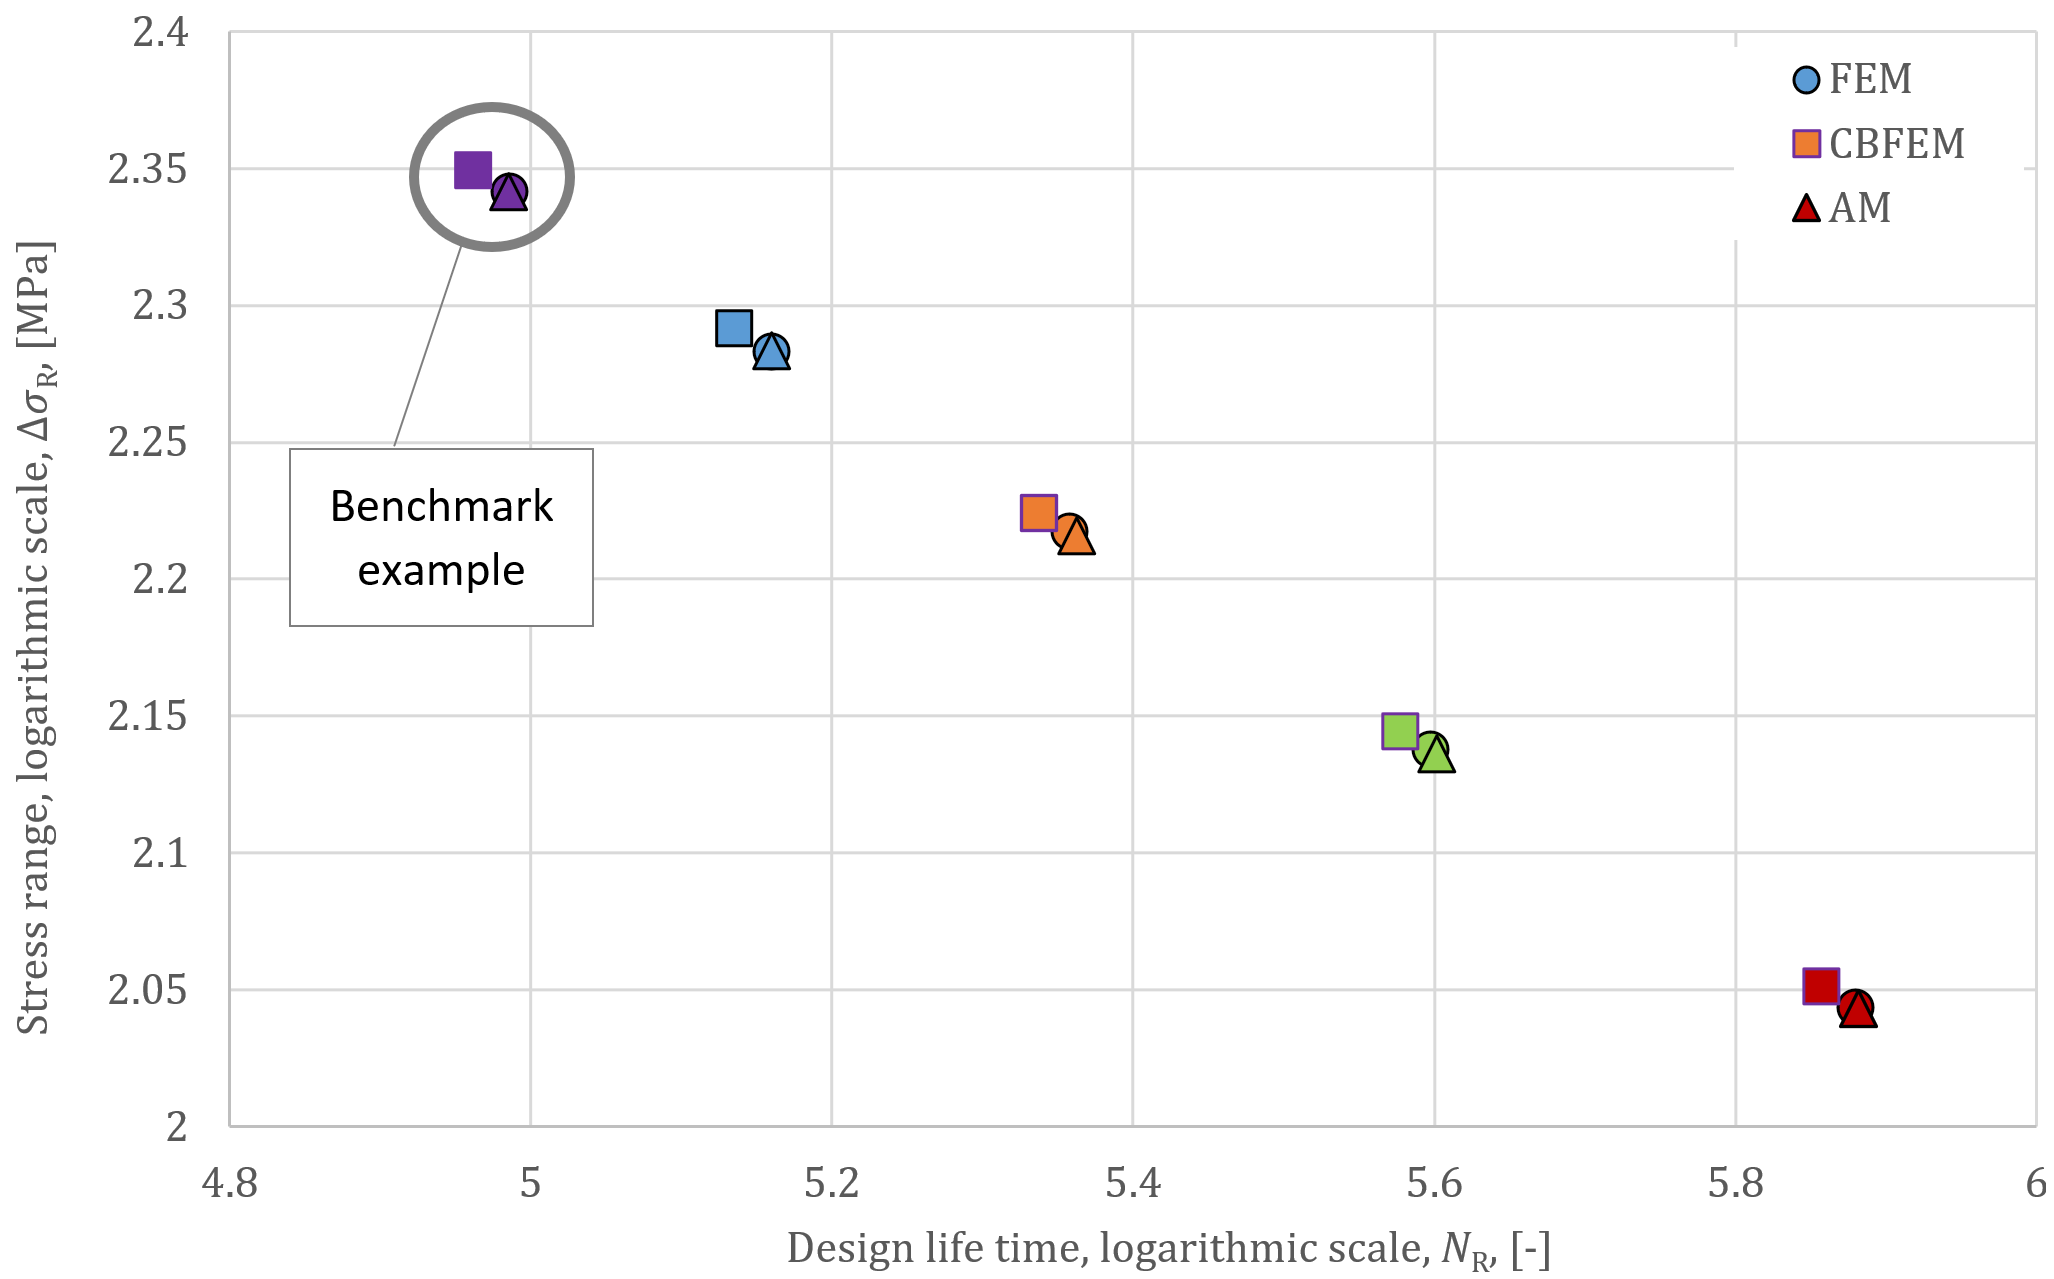
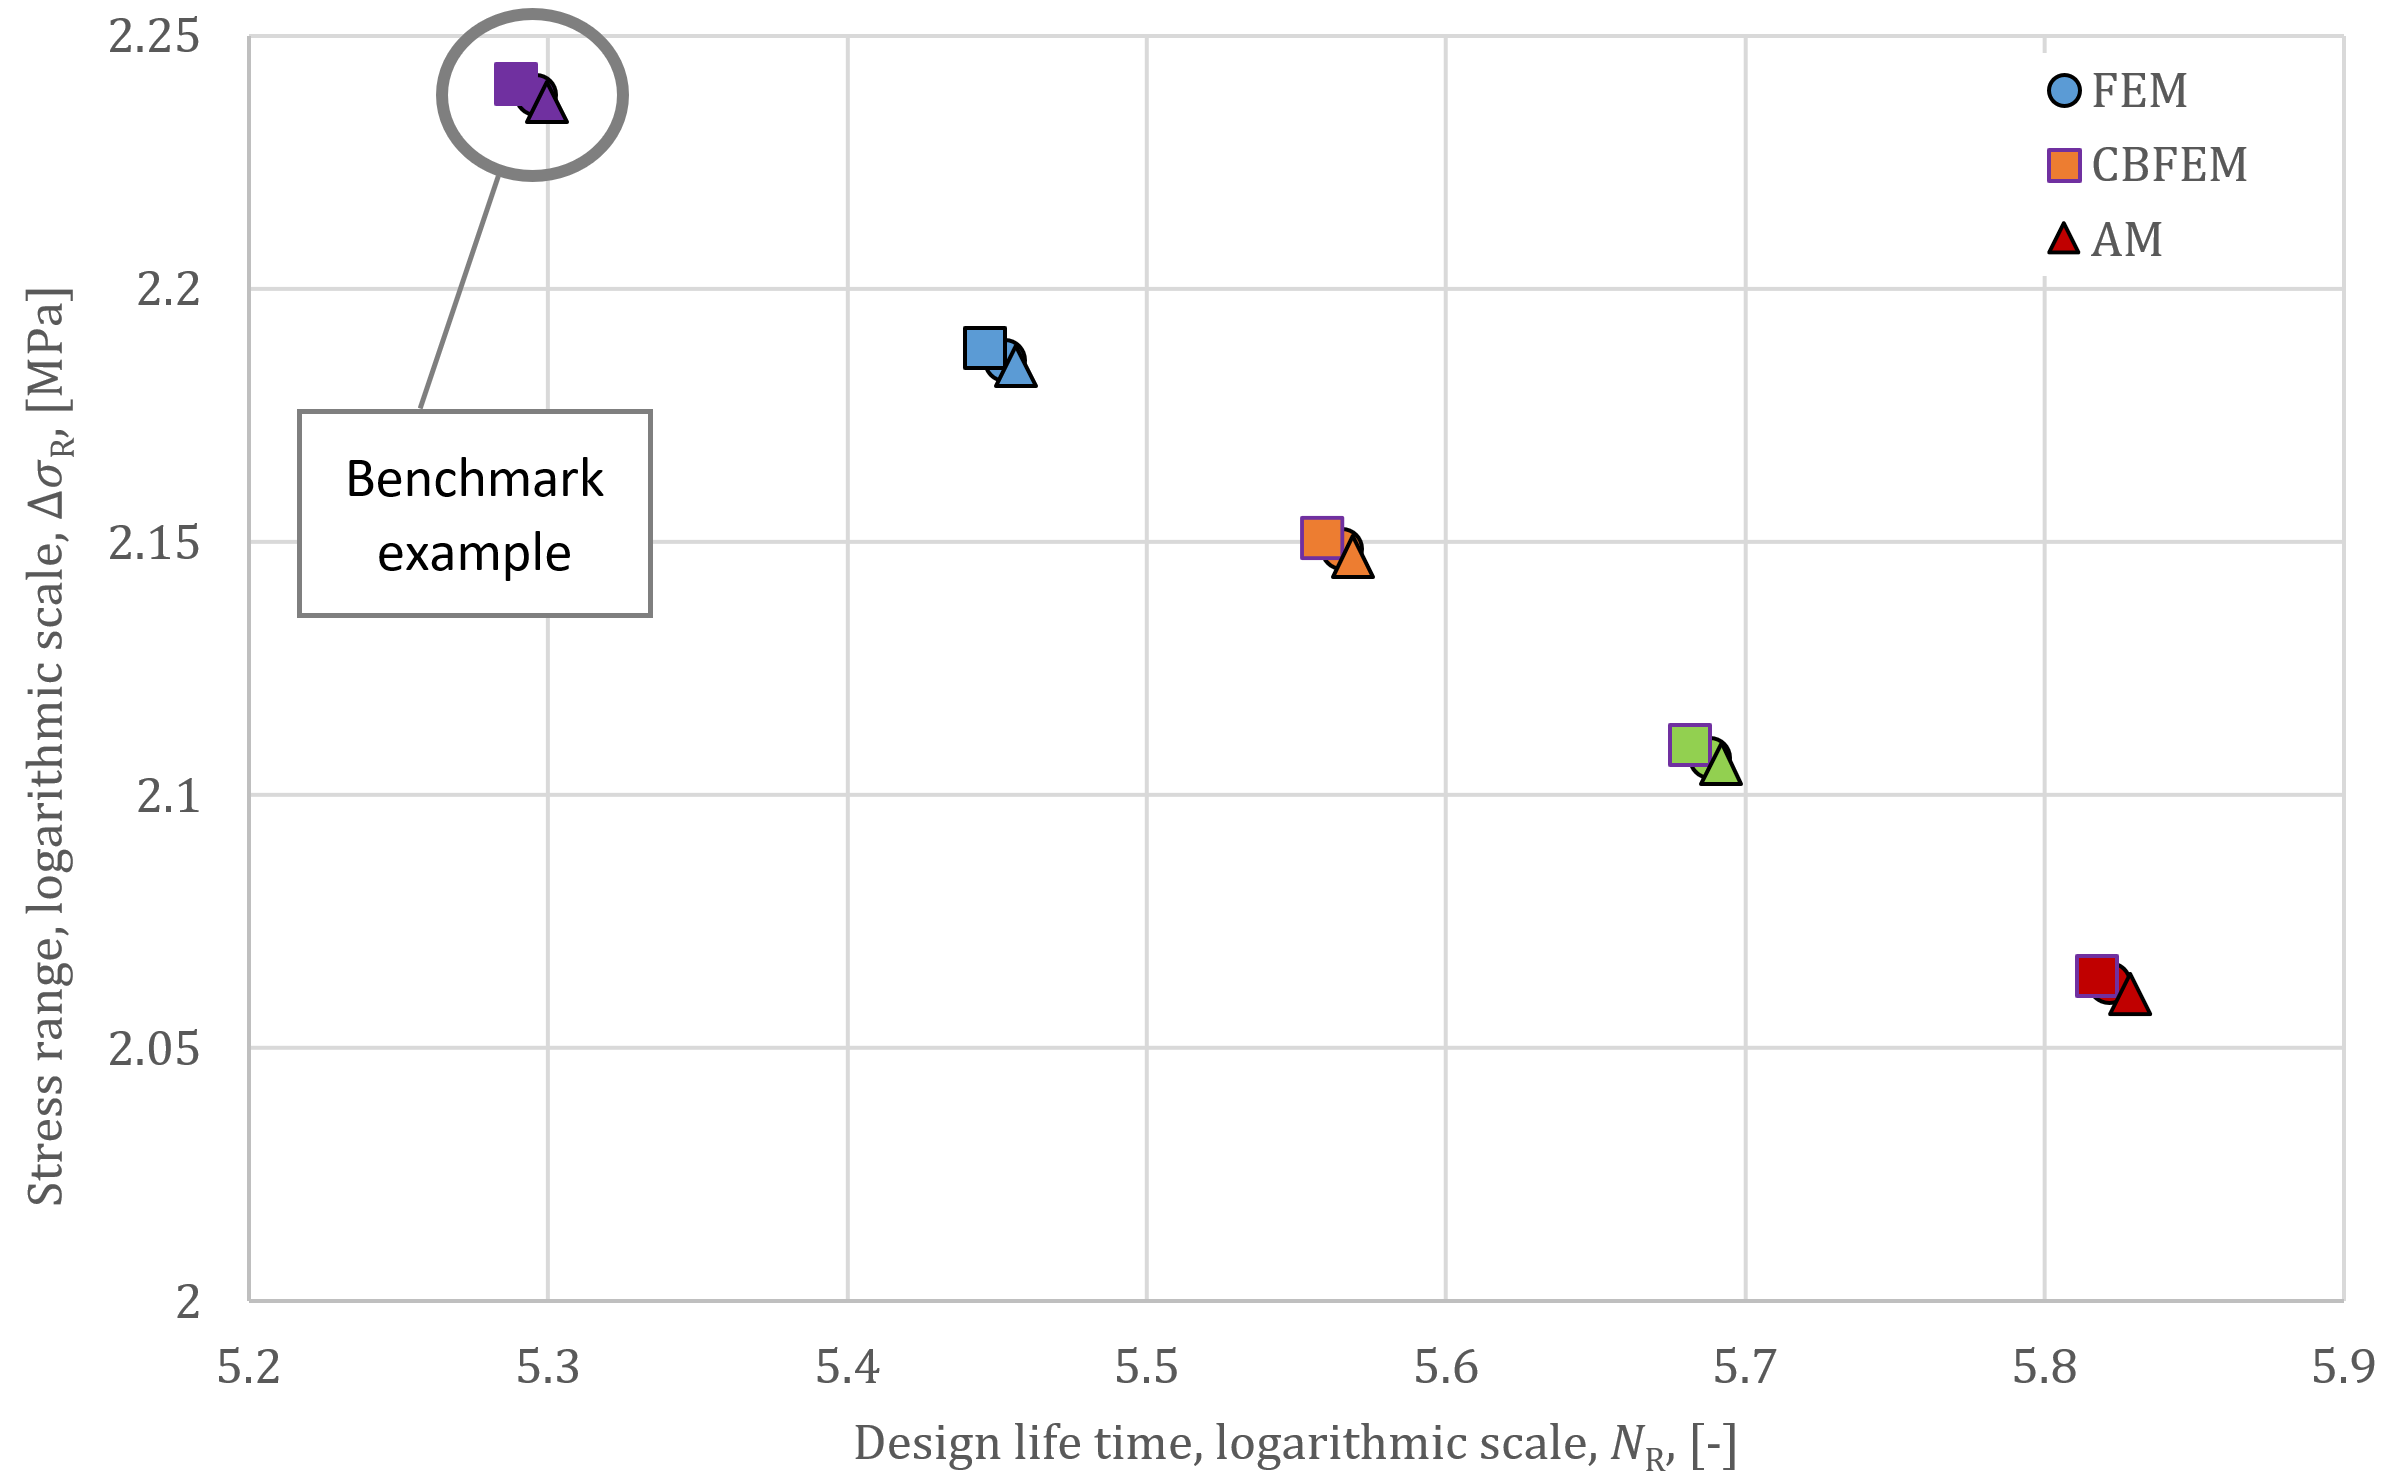
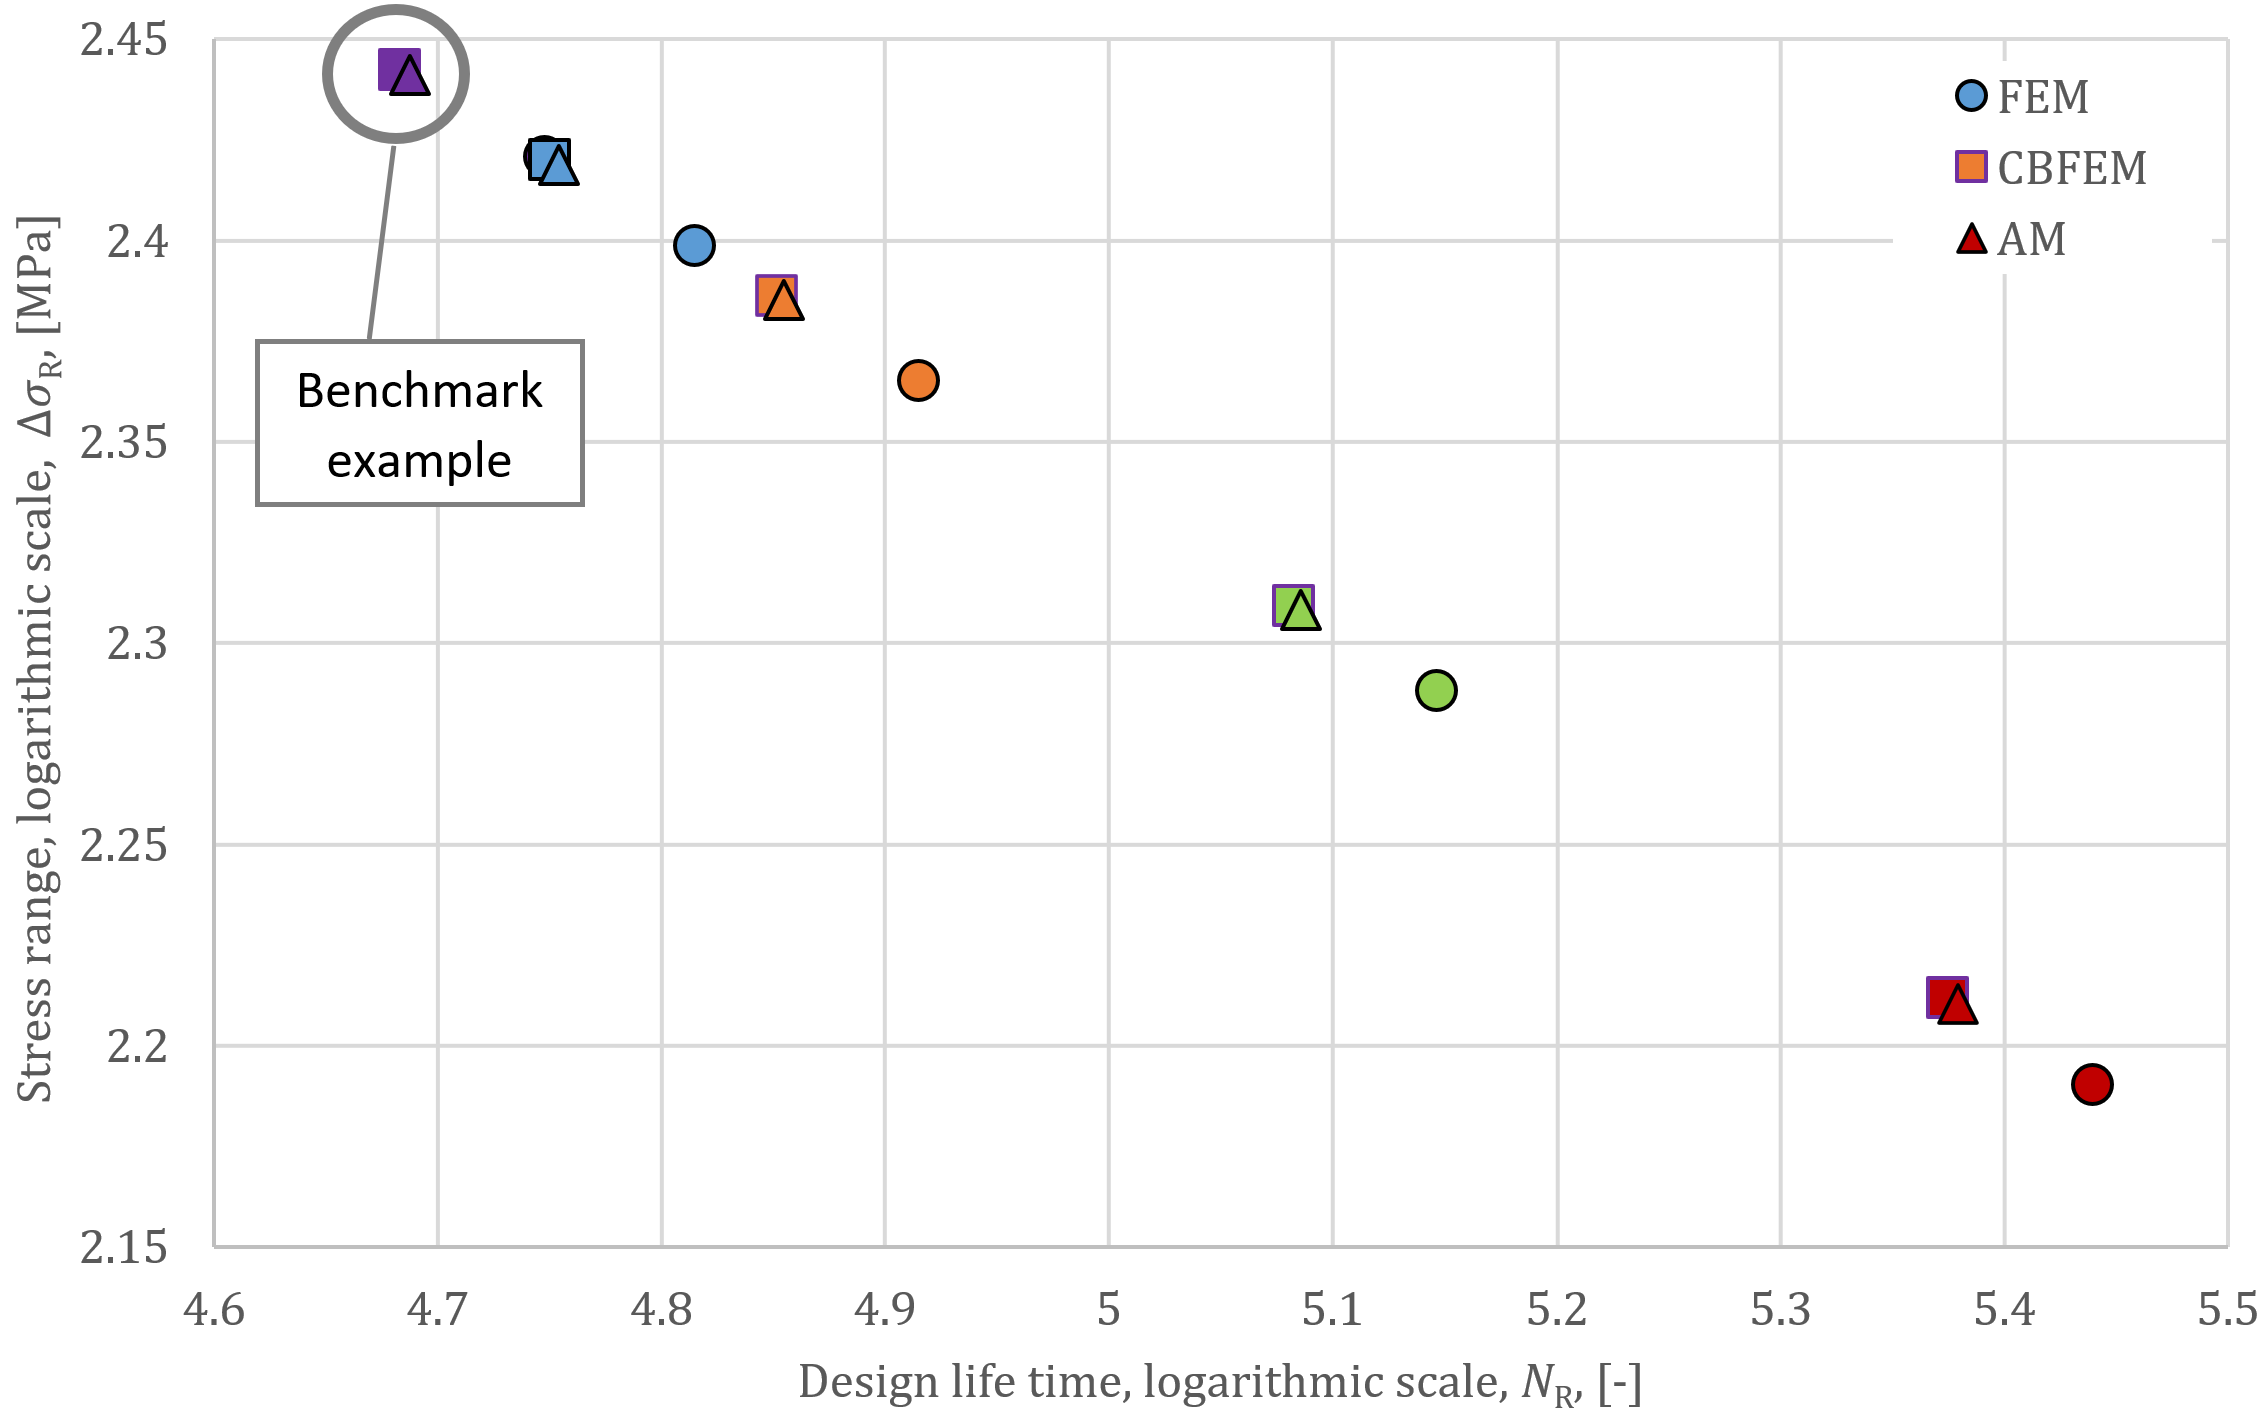
The numerical calculation CBFEM is verified on analytical and numerical FEM models according to the stress range and fatigue endurance; see Fig. 2. The average value of stress ranges difference is about 2%.
Fig. 2: A comparison of design lifetime NR values
2.5. Benchmark example
Inputs
Plates:
- Steel S450
- Plate 50 × 16 mm
Weld:
- Throat thickness = 6 mm
Load effects:
- \(F_{min}= 8.53\textrm{ kN}\)
- \(F_{max}= 85.33\textrm{ kN}\)
Outputs
- Minimum normal stress: \(\sigma_{min}= 10.9\textrm{ MPa}\)
- Maximum normal stress: \(\sigma_{max}= 108.7\textrm{ MPa}\)
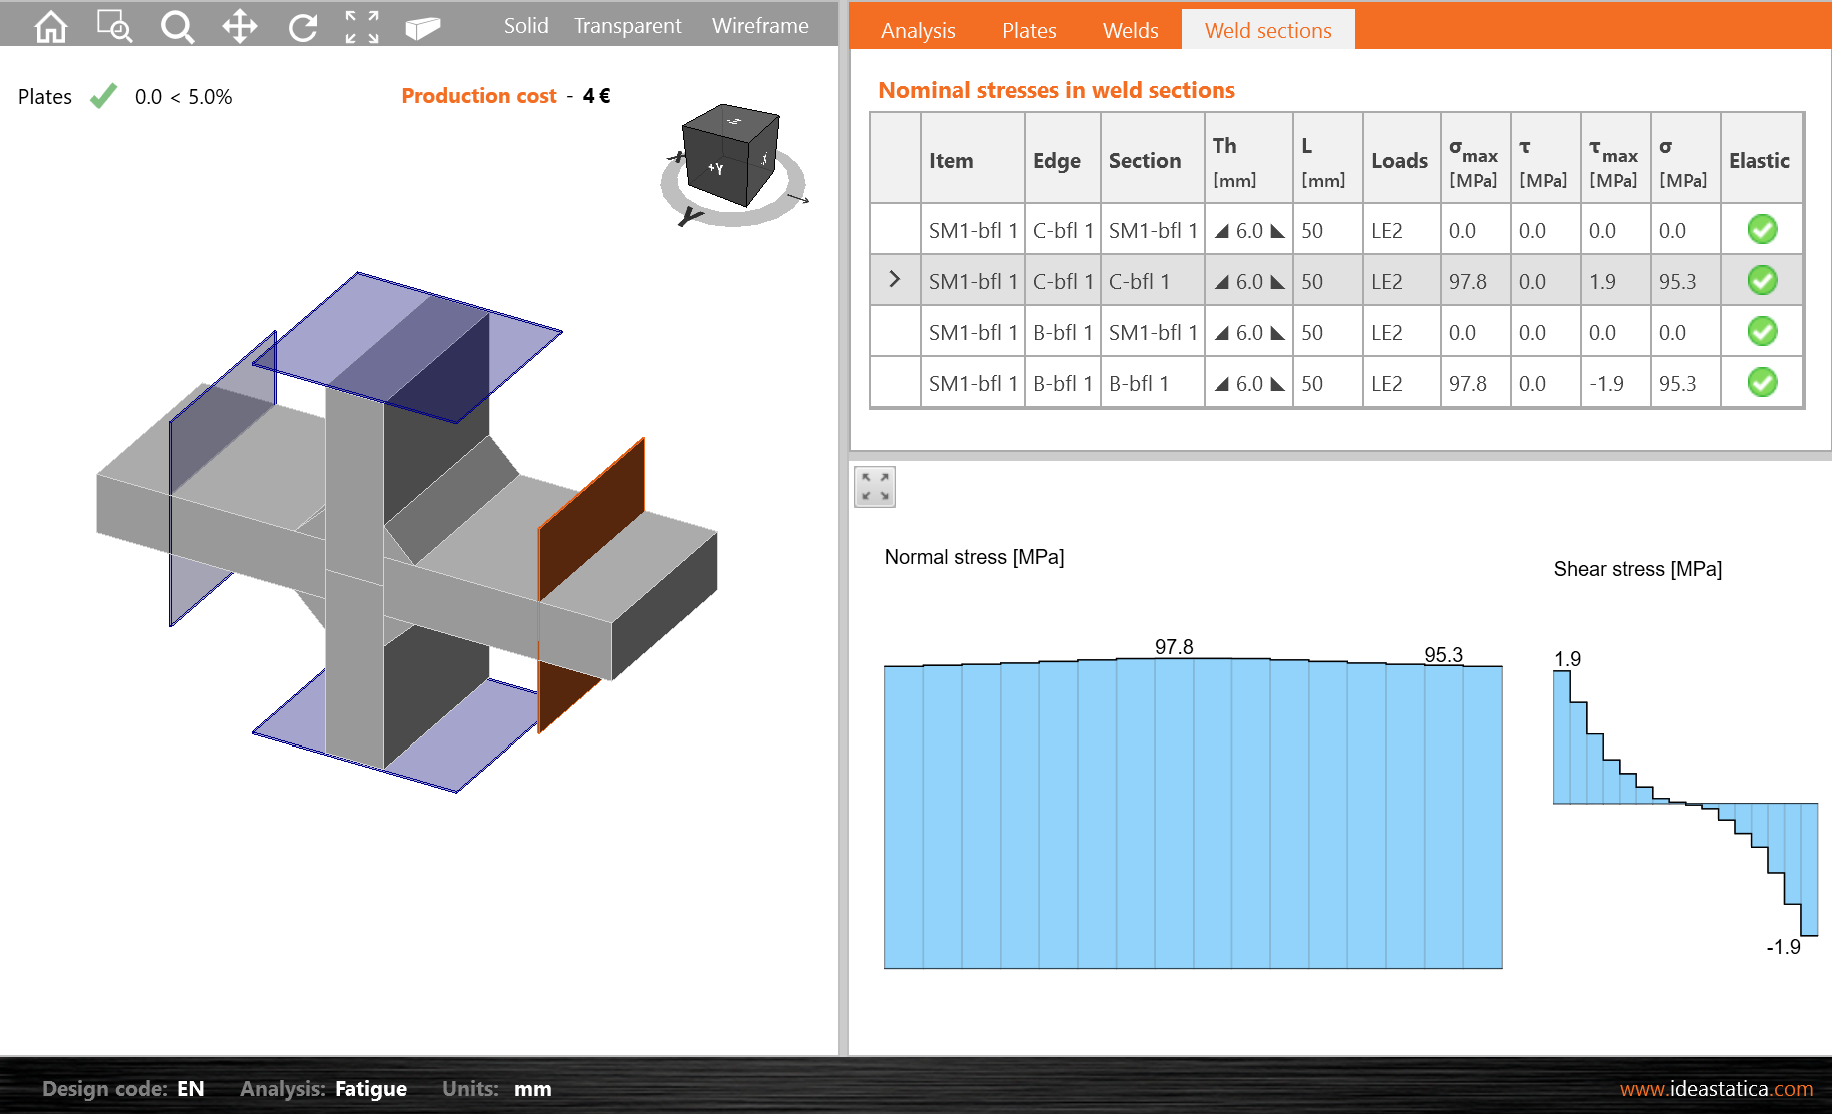
- Characteristic value of nominal stress range: \(\Delta \sigma_{E,2}= 97.8\textrm{ MPa}\)
- Design value of nominal stress range: \(\Delta \sigma_{R}= 112.5\textrm{ MPa}\)
- Reference value of fatigue strength: \(\sigma_c= 80\textrm{ MPa}\)
- The slope of fatigue strength curve: \(m=3\)
- Design lifetime \(N_R=7.2\cdot 10^5\)
Fig. 3: Characteristic value of nominal stress range
3. Cruciform joint of a plate with two transverse plates
3.1. Description
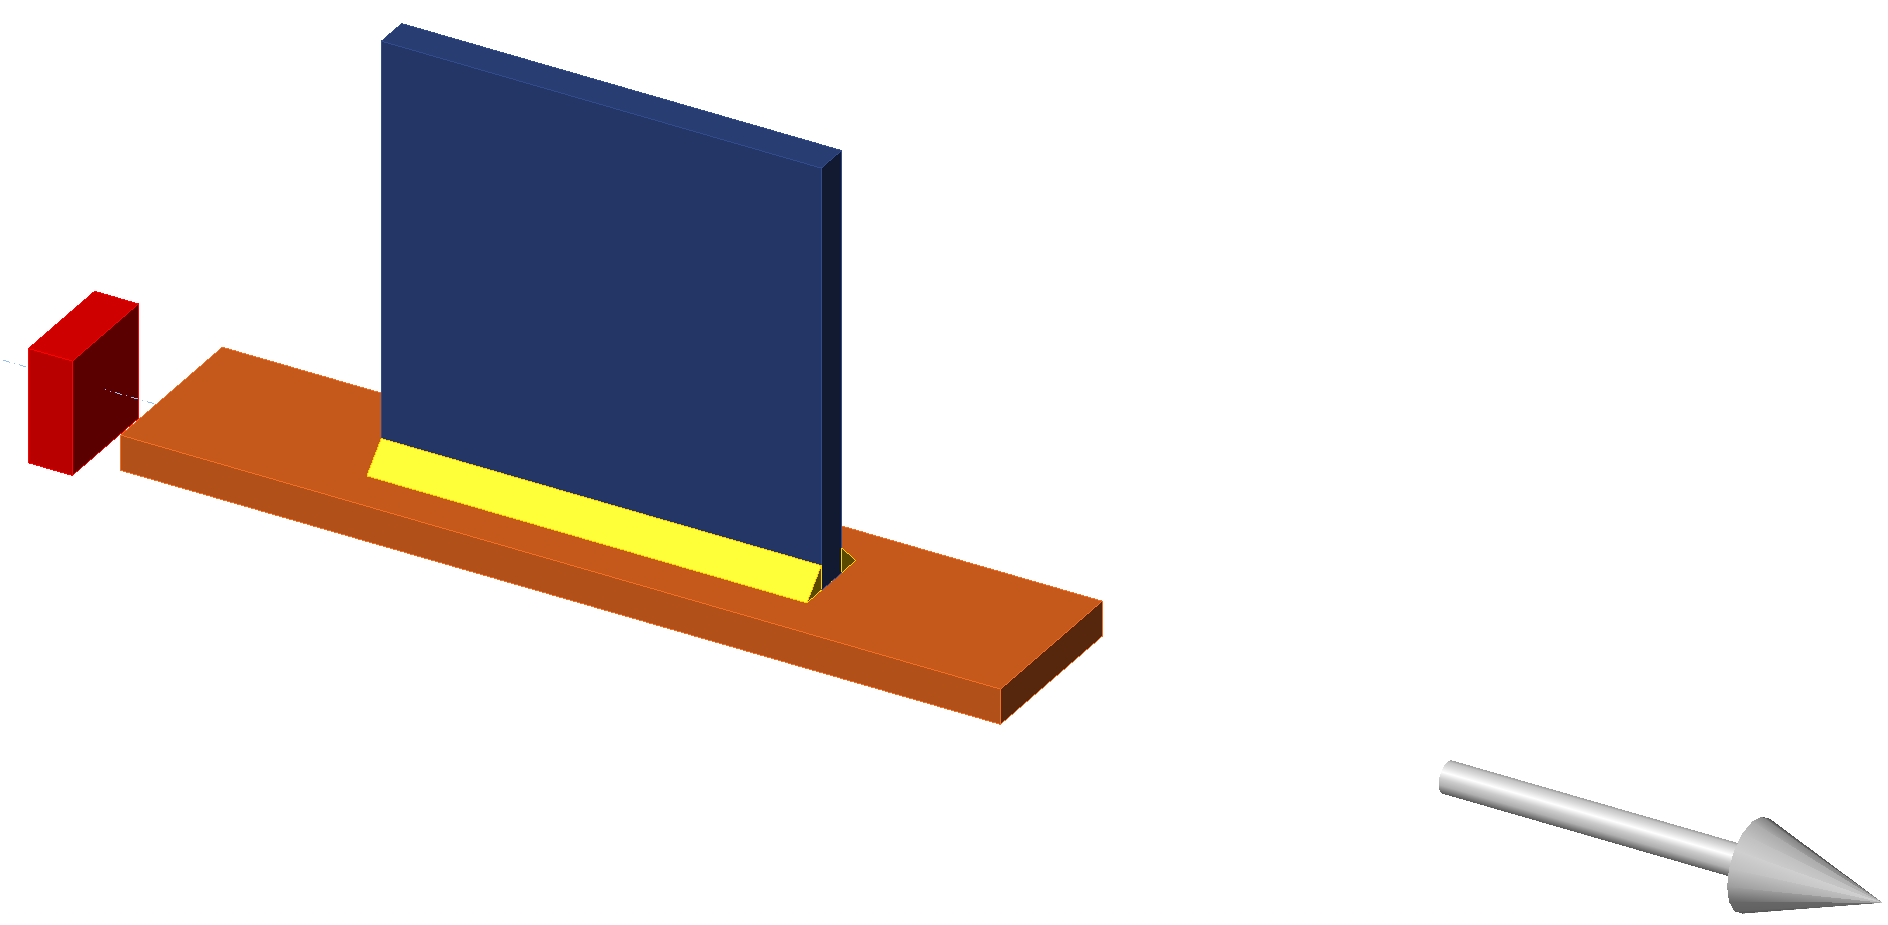
A welded cruciform joint with two transverse plates is created by fillet welds with a throat thickness of 4 mm; see Fig. 4. The plate dimensions are 90x10 mm. They are made of steel grade S235. The joint is loaded by tensile force.
Fig. 4: Welded cruciform joint with two transverse plates
According to EN 1993-1-9: 2005, this joint is construction detail 6 in Table 8.4. Its detail category is 80 because \(l=\textrm{thickness of plate}+2\times \textrm{thickness of weld}= 18\, \textrm{mm}\), i.e. \(l<50\,\textrm{mm}\).
3.2. Analytical and numerical models
The cross-sectional area of the plate, for this analytical calculation, is A = 900 mm2. Fatigue sections are created using weld sections at a distance from the weld toe to avoid the influence of peak stress from local weld geometry \( (9t = 90\textrm{ mm} \ge \textrm{width}=90\textrm{ mm}) \). The results of the analytical model AM, solid model FEM, and shell model CBFEM are given in Tab. 4.
Tab. 4: Results of solutions
| AM | FEM | CBFEM | |||||
| \(F_{max}\) | \(F_{min}\) | \(\Delta \sigma_R\) | \(N_R\) | \(\Delta \sigma_R\) | \(N_R\) | \(\Delta \sigma_R\) | \(N_R\) |
| [kN] | [kN] | [MPa] | [-] | [MPa] | [-] | [MPa] | [-] |
| 99 | 9 | 115 | 6.73E+05 | 115.5 | 6.64E+05 | 115.9 | 6.57E+05 |
| 108.9 | 9 | 127.7 | 4.92E+05 | 128 | 4.88E+05 | 128.7 | 4.81E+05 |
| 118.8 | 9 | 140.3 | 3.71E+05 | 140.7 | 3.68E+05 | 141.5 | 3.62E+05 |
| 128.7 | 9 | 153 | 2.86E+05 | 153.4 | 2.84E+05 | 154.2 | 2.79E+05 |
| 144 | 9 | 172.5 | 1.99E+05 | 173 | 1.98E+05 | 173.9 | 1.95E+05 |
3.3. Verification
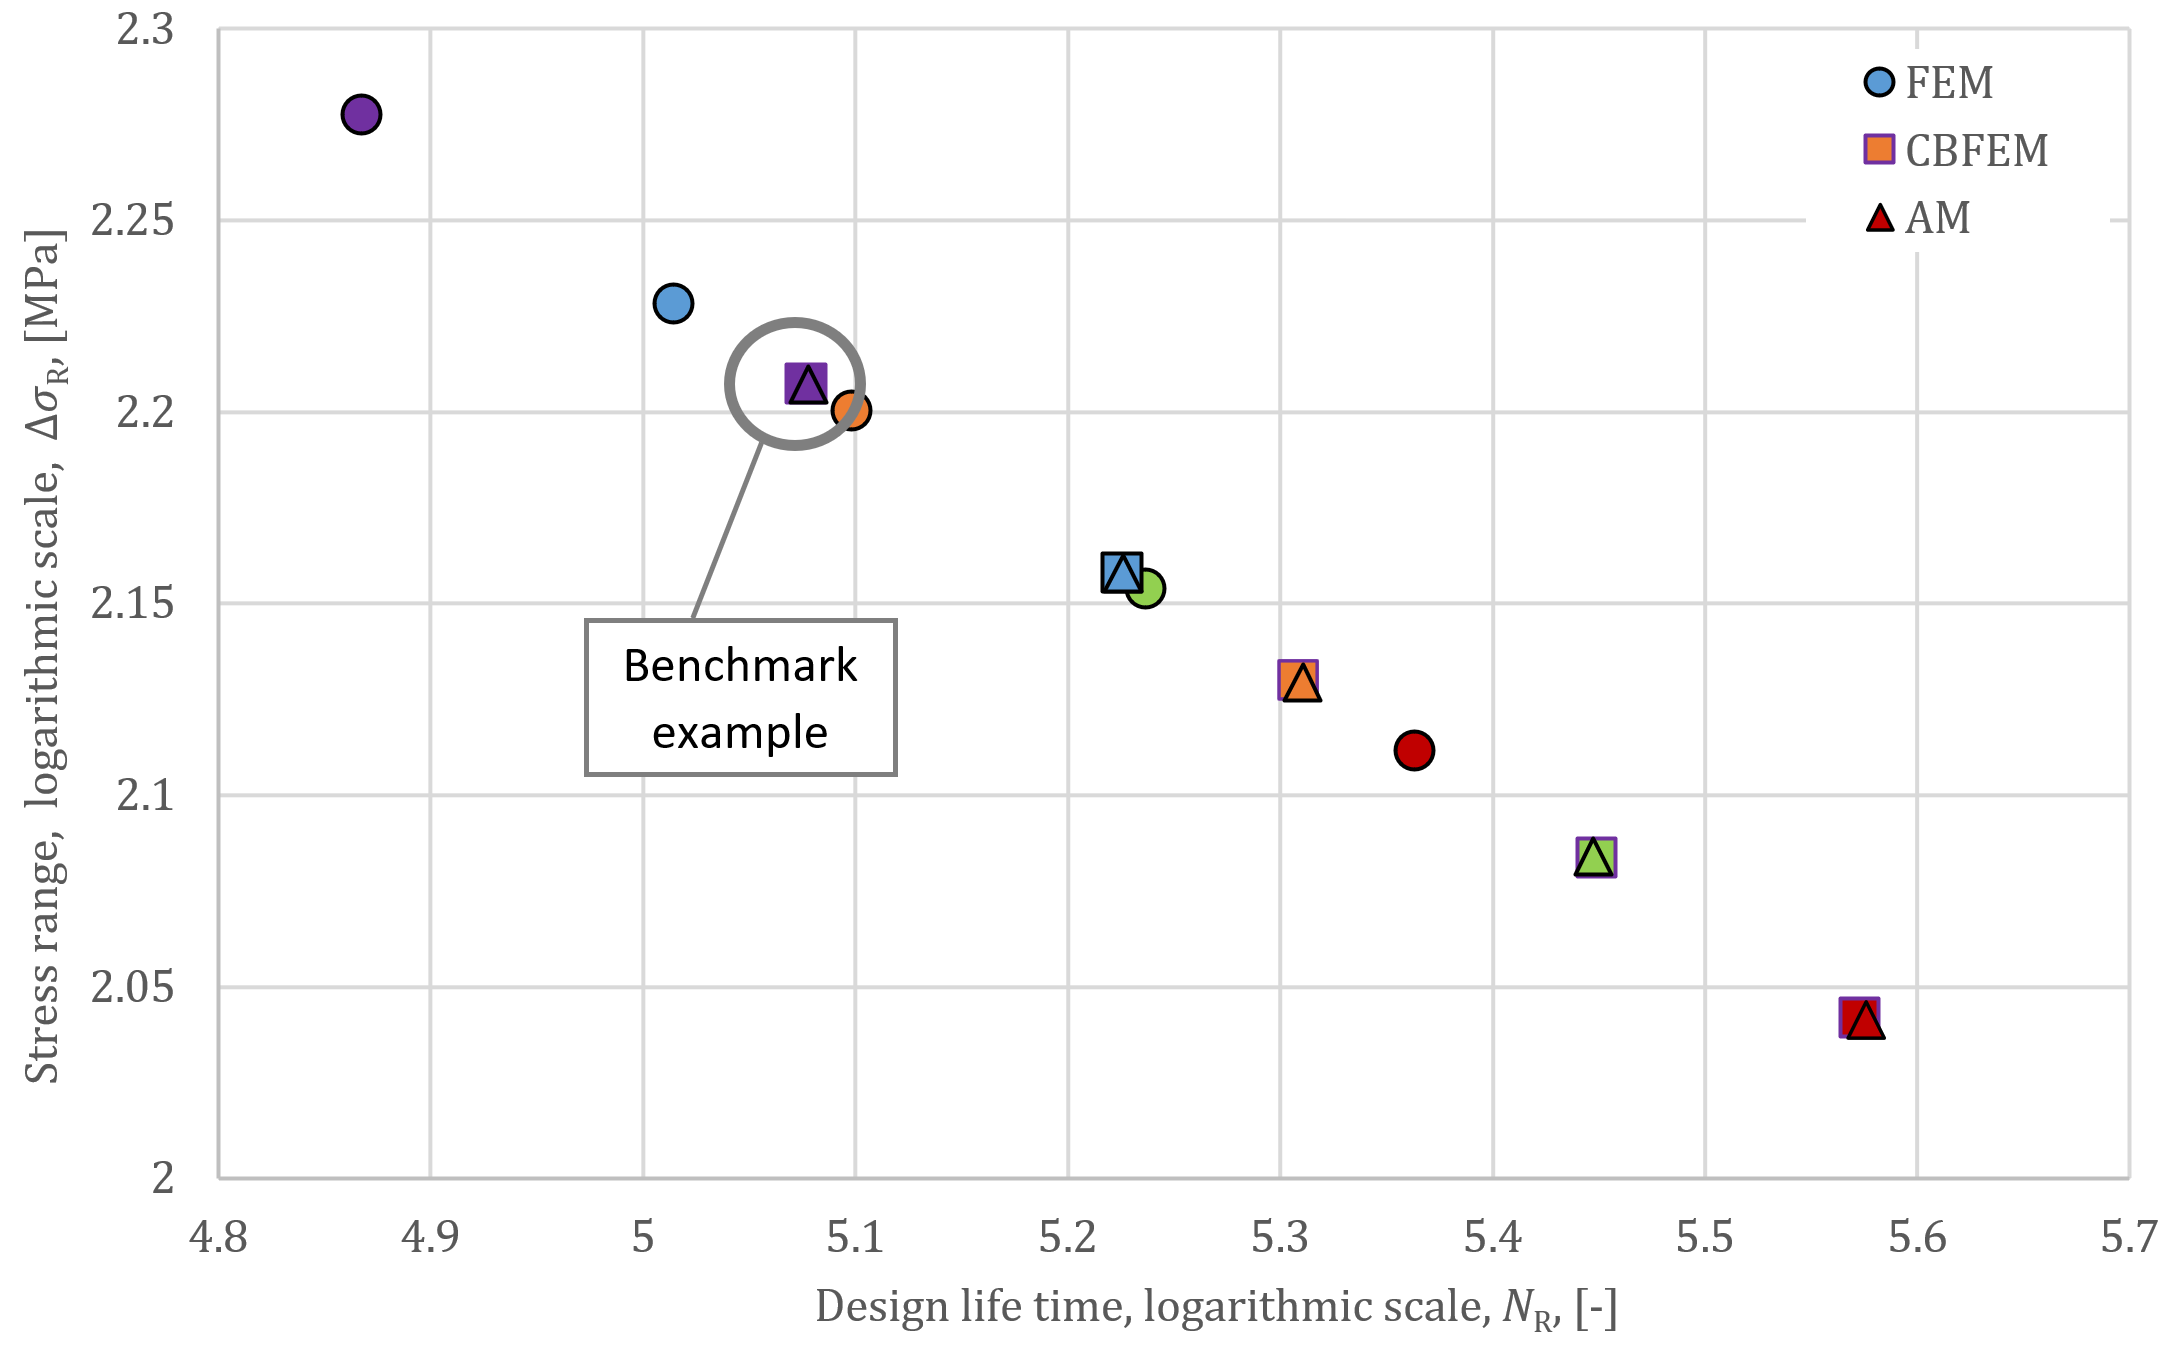
The numerical calculation CBFEM is verified on analytical and numerical FEM models according to the stress range and fatigue endurance, see Tab. 4 and Fig. 5. The maximum and average stress difference is less than 1%.
Fig. 5: Comparison of design lifetime NR values
3.4. Benchmark example
Inputs
Plates:
- Steel S235
- Plate 90 × 10 mm
Weld:
- Throat thickness = 4 mm
Load effects:
- \(F_{min}= 9\textrm{ kN}\)
- \(F_{max}= 99\textrm{ kN}\)
Outputs
- Minimum normal stress: \(\sigma_{min}= 10.1\textrm{ MPa}\)
- Maximum normal stress: \(\sigma_{max}= 110.9\textrm{ MPa}\)
- Characteristic value of nominal stress range: \(\Delta \sigma_{E,2}= 100.8\textrm{ MPa}\)
- Design value of nominal stress range: \(\Delta \sigma_{R}= 115.9\textrm{ MPa}\)
- Reference value of fatigue strength: \(\sigma_c= 80\textrm{ MPa}\)
- The slope of fatigue strength curve: \(m=3\)
- Design lifetime \(N_R=6.57\cdot 10^5\)
4. A welded T joint with a longitudinal plate
4.1. Description
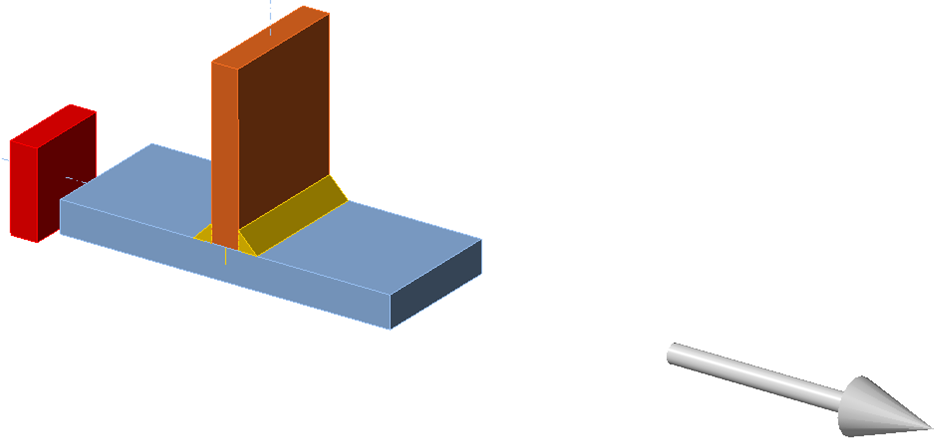
A longitudinal plate with the dimensions 100 x 8 mm is welded to a plate with the dimensions 40 x 8 mm by fillet welds with a throat thickness of 4 mm; see Fig. 6. Both plates are of steel grade S355. The joint is loaded by tensile force.
Fig. 6: A welded T joint plate with a longitudinal plate
According to EN 1993-1-9:2005, this joint is construction detail 1 in table 8.4. Its detail category is 63 because \(L=100 \textrm{ mm}\), i.e. \(80<L<100\textrm{ mm}\).
4.2. Analytical and numerical models
The cross-sectional area of the plate, for this analytical calculation, is A = 320 mm2. Fatigue sections are created using a working plane at a 40 mm distance from the weld toe to avoid the influence of peak stress from local weld geometry. The results of the analytical model AM, solid model FEM and shell model CBFEM are given in Tab. 5.
Tab. 5: Results of solutions
| AM | FEM | CBFEM | |||||
| \(F_{max}\) | \(F_{min}\) | \(\Delta \sigma_R\) | \(N_R\) | \(\Delta \sigma_R\) | \(N_R\) | \(\Delta \sigma_R\) | \(N_R\) |
| [kN] | [kN] | [MPa] | [-] | [MPa] | [-] | [MPa] | [-] |
| 34 | 3.4 | 110.0 | 3.76E+05 | 129.4 | 2.31E+05 | 110.2 | 3.74E+05 |
| 37.5 | 3.8 | 121.3 | 2.8E+05 | 142.6 | 1.72E+05 | 121.2 | 2.81E+05 |
| 41.7 | 4.2 | 134.7 | 2.05E+05 | 158.6 | 1.25E+05 | 135.0 | 2.03E+05 |
| 44.5 | 4.5 | 143.8 | 1.68E+05 | 169.1 | 1.03E+05 | 143.9 | 1.68E+05 |
| 49.8 | 5.0 | 161.0 | 1.2E+05 | 189.4 | 7.36E+04 | 161.2 | 1.19E+05 |
4.3. Verification
The numerical calculation CBFEM is verified on analytical and numerical FEM models according to the stress range and fatigue design lifetime, see Tab. 5 and Fig. 7. The maximum and average stress difference with the analytical model is about 1%. The difference between FEM and CBFEM is higher due to the difference between the solid and shell model and how eccentricity is taken into account.
Fig. 7: Comparison of design lifetime NR values
4.4. Benchmark example
Inputs
Plates:
- Steel S355
- Plate 40 × 8 mm
- Plate 100 × 8 mm
Weld:
- Weld throat thickness = 4 mm
Load effects:
- \(F_{min}= 3.4\textrm{ kN}\)
- \(F_{max}= 34\textrm{ kN}\)
Outputs
- Minimum normal stress: \(\sigma_{min}= 10.6\textrm{ MPa}\)
- Maximum normal stress: \(\sigma_{max}= 106.4\textrm{ MPa}\)
- Characteristic value of nominal stress range: \(\Delta \sigma_{E,2}= 95.8\textrm{ MPa}\)
- Design value of nominal stress range: \(\Delta \sigma_{R}= 110.2\textrm{ MPa}\)
- Reference value of fatigue strength: \(\sigma_c= 63\textrm{ MPa}\)
- The slope of fatigue strength curve: \(m=3\)
- Design lifetime \(N_R=3.74\cdot 10^5\)
5. A welded T joint with a transverse plate
5.1. Description
A welded T joint with a plate with the dimensions 50 x 12 mm and a transverse plate with the dimensions 50x10 mm are made of steel grade S355 by fillet welds, throat thickness 5 mm; see Fig. 8. The joint is loaded by tensile force.
Fig. 8. A welded T joint with transverse plate
According to EN 1993-1-9: 2005, this joint is construction detail 6 in Table 8.4. Its detail category is 80 because \(l=\textrm{thickness of plate}+2\times \textrm{thickness of weld}= 20\, \textrm{mm}\), i.e. \(l<50\,\textrm{mm}\).
5.2. Analytical and numerical models
The cross-sectional area of the plate, for this analytical calculation, is A = 600 mm2. Fatigue sections are created using weld sections at 5t distance from the weld toe to avoid the influence of peak stress from local weld geometry (\(5t=60\textrm{ mm} > t=50\textrm{ mm}\)). The results of the analytical model AM, solid model FEM and shell model CBFEM are given in Tab. 6.
Tab. 6: Results of solutions
| AM | FEM | CBFEM | |||||
| \(F_{max}\) | \(F_{min}\) | \(\Delta \sigma_R\) | \(N_R\) | \(\Delta \sigma_R\) | \(N_R\) | \(\Delta \sigma_R\) | \(N_R\) |
| [kN] | [kN] | [MPa] | [-] | [MPa] | [-] | [MPa] | [-] |
| 94.1 | 9.4 | 162.3 | 2.39E+05 | 155.0 | 2.75E+05 | 162.8 | 2.37E+05 |
| 117.8 | 11.8 | 203.2 | 1.22E+05 | 194.0 | 1.4E+05 | 203.8 | 1.21E+05 |
| 140.7 | 14.1 | 242.8 | 7.16E+04 | 231.8 | 8.23E+04 | 243.3 | 7.11E+04 |
| 152.0 | 15.2 | 262.2 | 5.68E+04 | 250.3 | 6.53E+04 | 263.0 | 5.63E+04 |
| 160.0 | 16.0 | 276.0 | 4.87E+04 | 263.5 | 5.6E+04 | 276.9 | 4.82E+04 |
5.3. Verification
The numerical calculation CBFEM is verified on analytical and numerical FEM models according to the stress range and fatigue lifetime, see Fig. 9 and Tab. 6. The maximum and average stress difference with the analytical model is about 1%. In this case, eccentricity does not have a big influence; the difference FEM and CBFEM is about 5%.
Fig. 9: Comparison of design lifetime NR
5.4. Benchmark example
Inputs
Plates:
- Steel S355
- Plate 50 × 12 mm
- Transverse plate 50 × 10 mm
Weld:
- Throat thickness = 5 mm
Load effects:
- \(F_{min}= 9.4\textrm{ kN}\)
- \(F_{max}= 94.1\textrm{ kN}\)
Outputs
- Minimum normal stress: \(\sigma_{min}= 15.7\textrm{ MPa}\)
- Maximum normal stress: \(\sigma_{max}= 157.3\textrm{ MPa}\)
- Characteristic value of nominal stress range: \(\Delta \sigma_{E,2}= 141.6\textrm{ MPa}\)
- Design value of nominal stress range: \(\Delta \sigma_{R}= 162.8\textrm{ MPa}\)
- Reference value of fatigue strength: \(\sigma_c= 80\textrm{ MPa}\)
- The slope of fatigue strength curve: \(m=3\)
- Design lifetime \(N_R=2.37\cdot 10^5\)
Verification examples were prepared by Kirill Golubiatnikov at Czech Technical University in Prague.


