Comparison of concrete cone failure according to EN 1994-2 and 3D CSFM
The design standard EN 1994-2 in clause 7.2.1.4 describes the procedure for the design of anchors or groups of anchors on the concrete cone failure mode. This mode of failure is typical for tension-loaded anchors. From formula 7.1 of this chapter, it can be seen that only the geometric aspect and the effect of tearing are taken into account in the calculation, whereas the effect of reinforcement is almost not taken into account at all (only in the coefficient defined in 7.2.1.4 (5)).
In this text, we will demonstrate the design of a simple base plate with four anchors, according to the aforementioned article 7.2.1.4, and compare the results with the 3D CSFM method for a plain concrete block, incorrectly reinforced, and for a block with correctly specified additional reinforcement. We will also show how the additional reinforcement can increase the load-bearing capacity and look at the transfer of tensile force from the anchor to the additional reinforcement using a single anchor as an example.
A base plate with 4 anchors
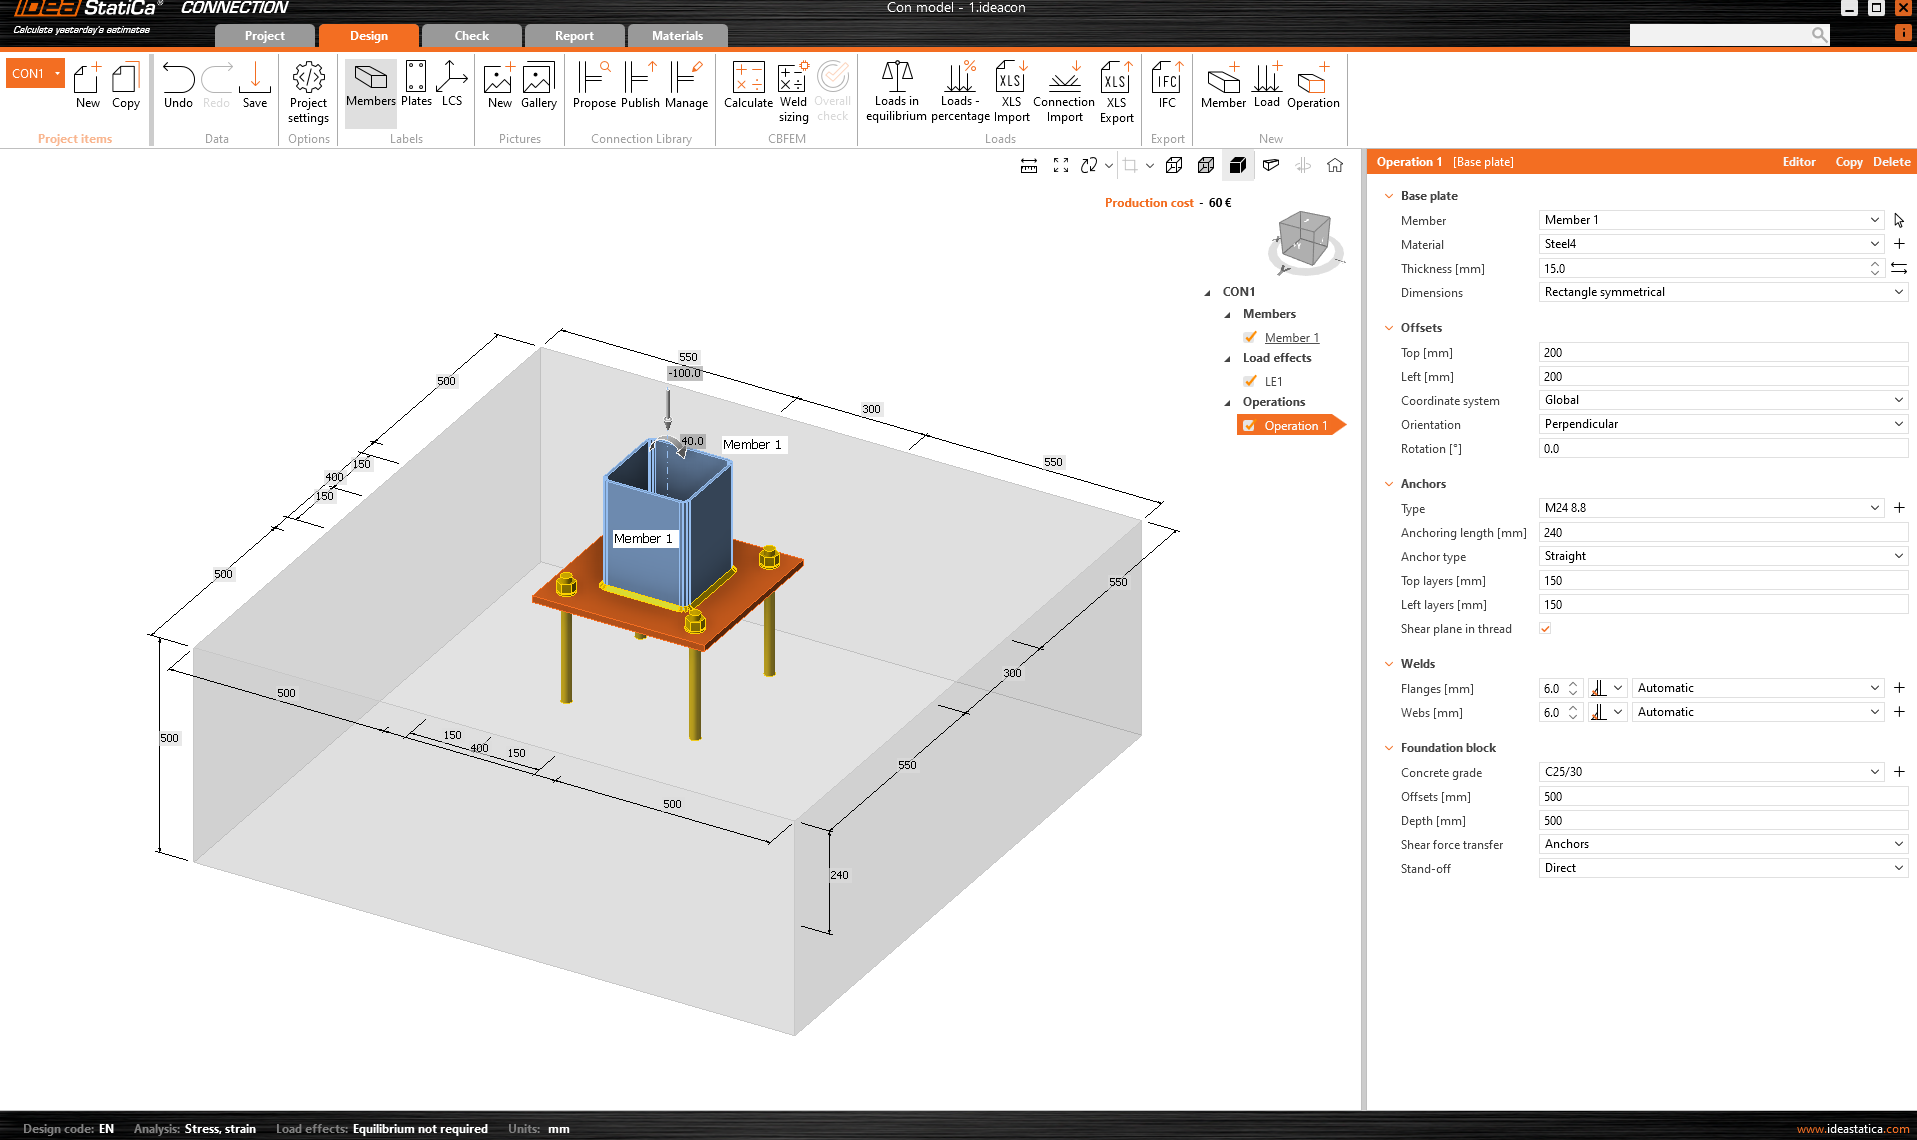
As an example, we chose the SHS200/200/6.3 profile anchored into a concrete block with dimensions of 1/1/0.5 m. The model is loaded with a compressive normal force and bending moment. The shear component of the load has been deliberately omitted to keep the example as clear as possible.
\[ \textsf{\textit{\footnotesize{Fig. 1\qquad Model in IDEA StatiCa Connection}}}\]
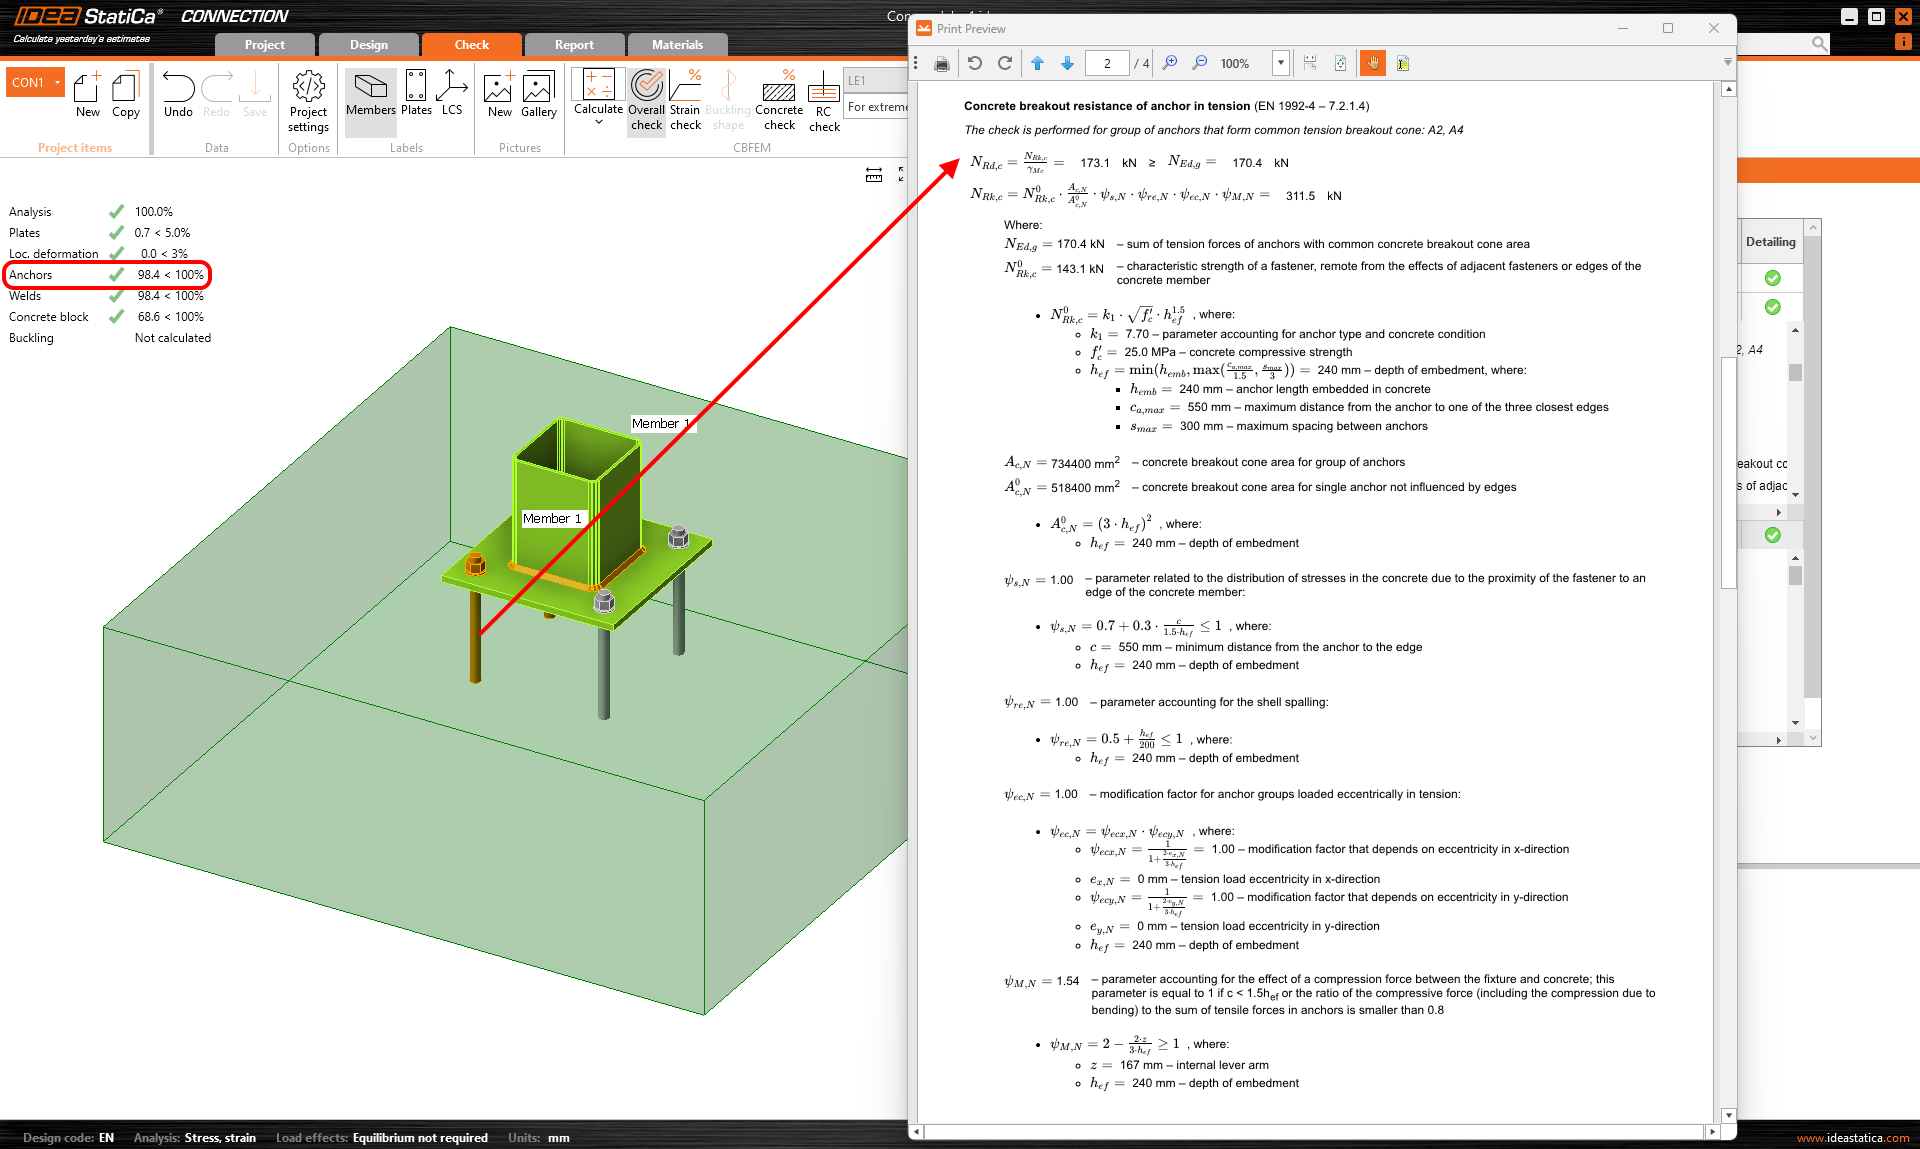
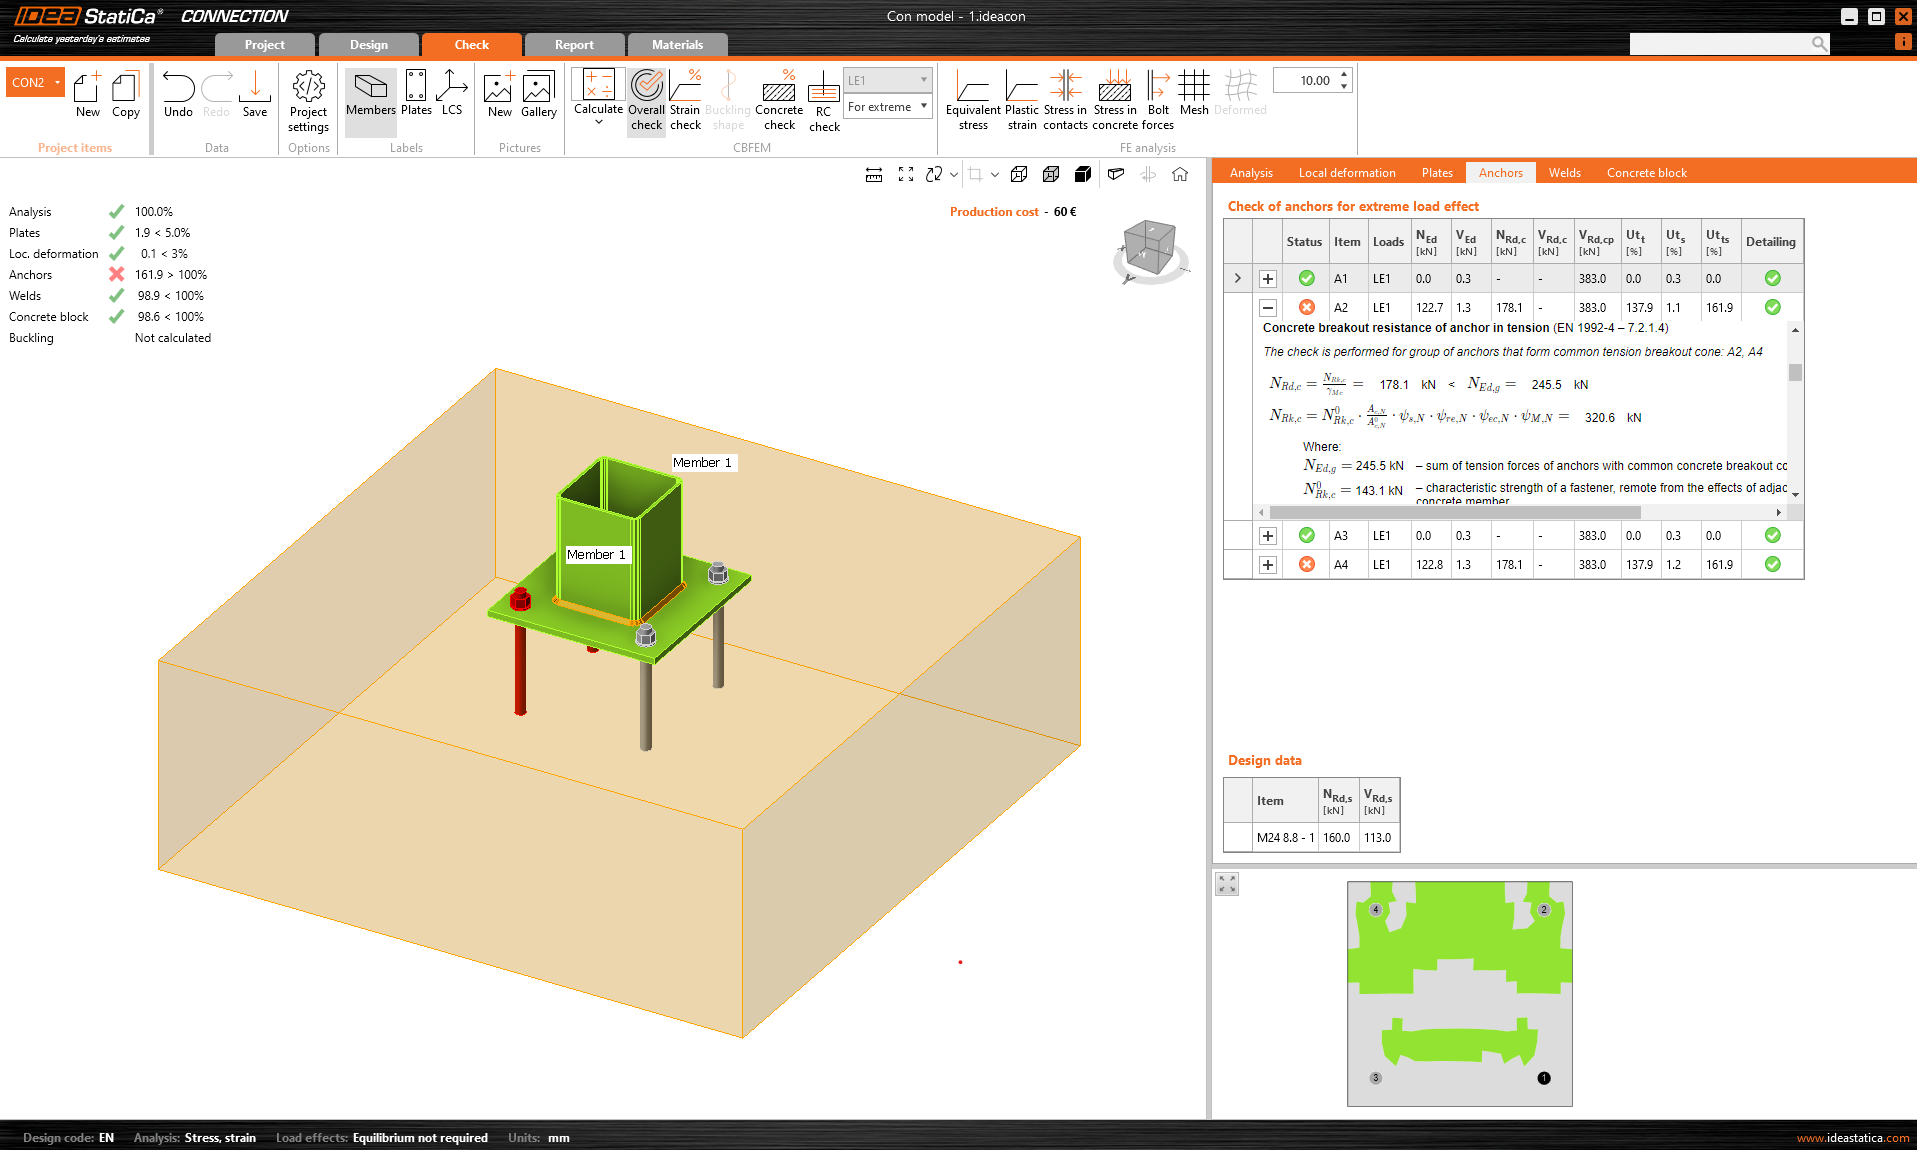
The example is first modeled in IDEA StatiCa Connection, where we set the load so that the Concrete breakout resistance of the anchor in tension (EN 1992-4 - 7.2.1.4) is almost 100%.
\[ \textsf{\textit{\footnotesize{Fig. 2\qquad Concrete breakout resistance of the anchor in tension (EN 1992-4 - 7.2.1.4)}}}\]
The figure also shows the calculation, including all intermediate results. Now, we will use the possibility of exporting this model to the IDEA StatiCa Detail application, where the 3D CSFM is implemented.
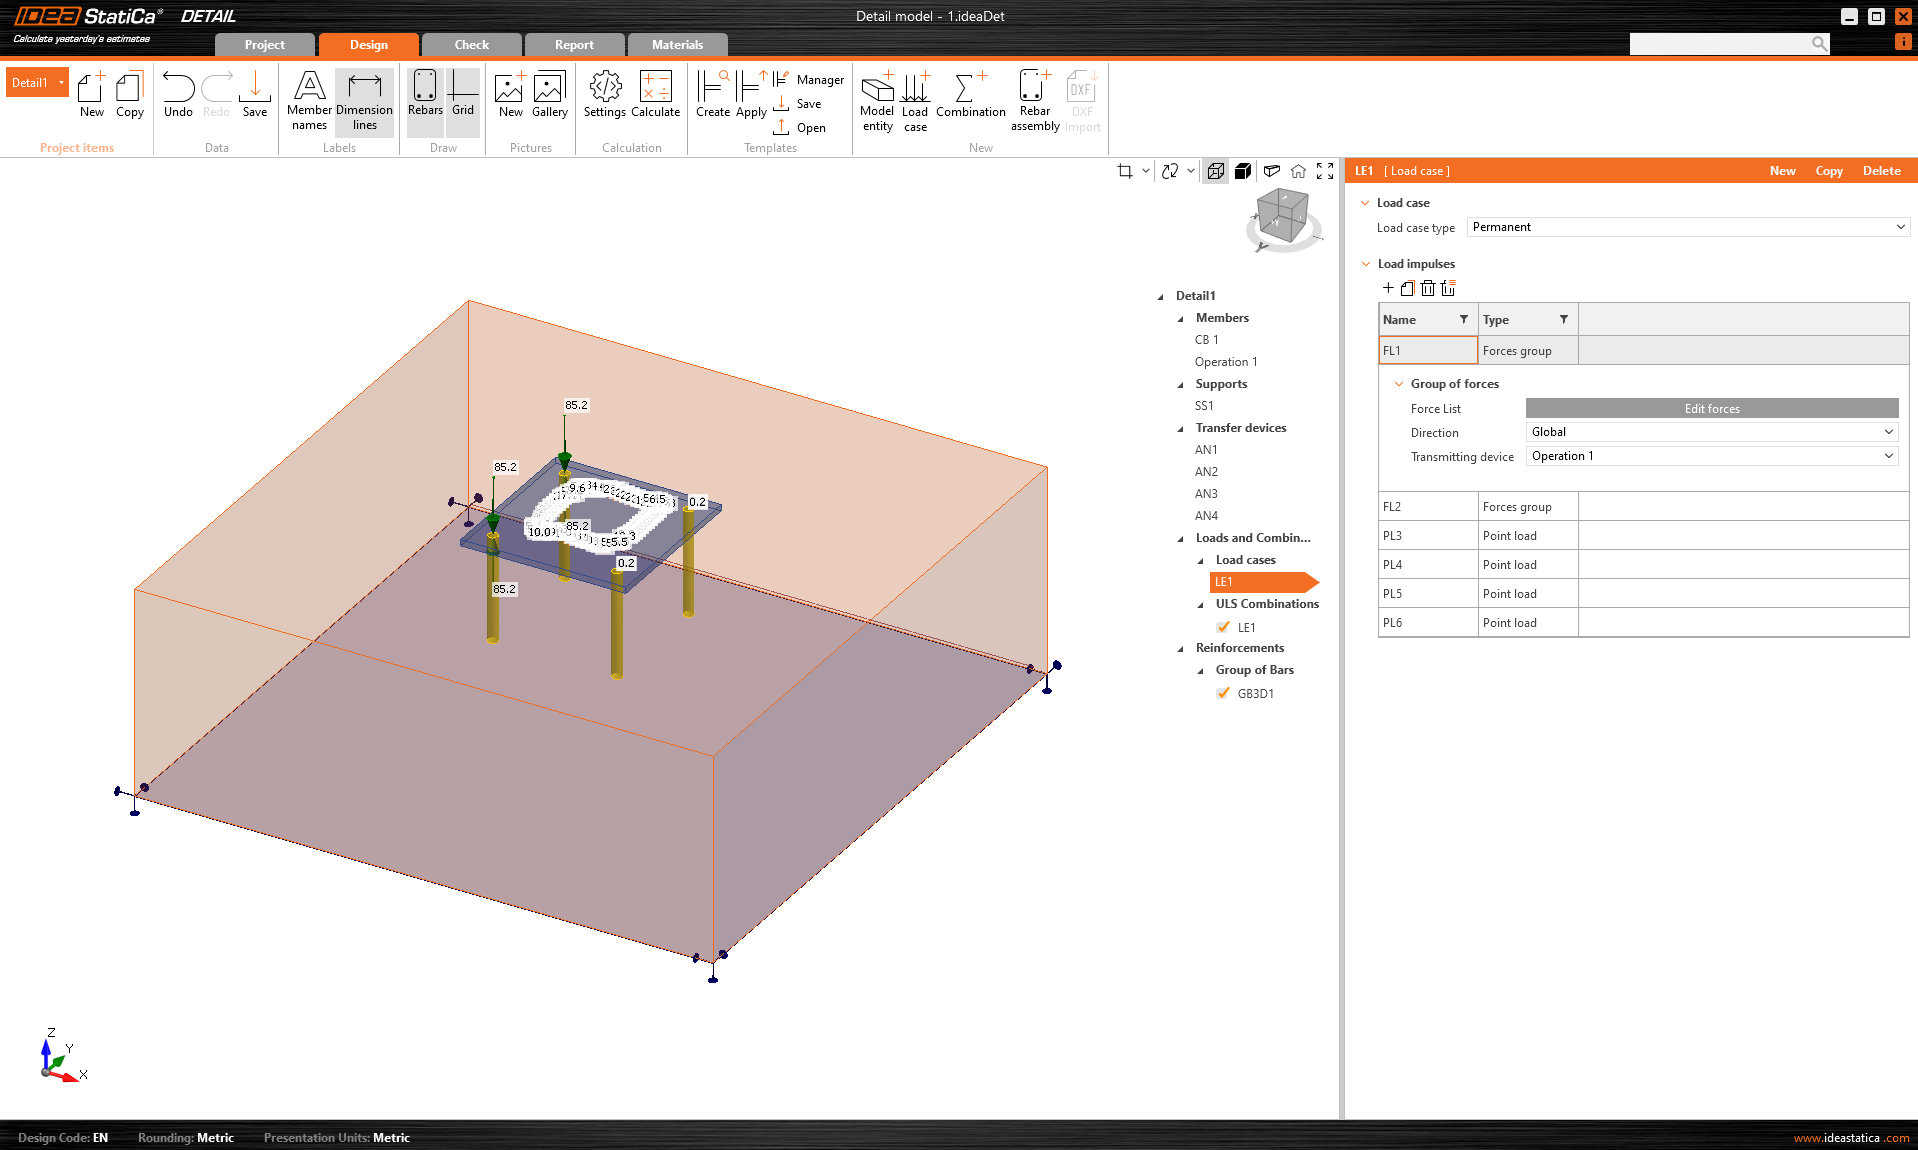
The concrete block, anchors, base plate, and loads are transferred.
\[ \textsf{\textit{\footnotesize{Fig. 3\qquad Model in IDEA StatiCa Detail}}}\]
Surface support is automatically placed on the bottom surface of the concrete, but the model now contains no reinforcement or other loads, such as the self-weight of the concrete block. In terms of loads, only the impulses from the steel part have been transferred. As you can see, the loads are applied at the welds and at the anchors themselves. Further information on load transfer can be obtained from the Theoretical background.
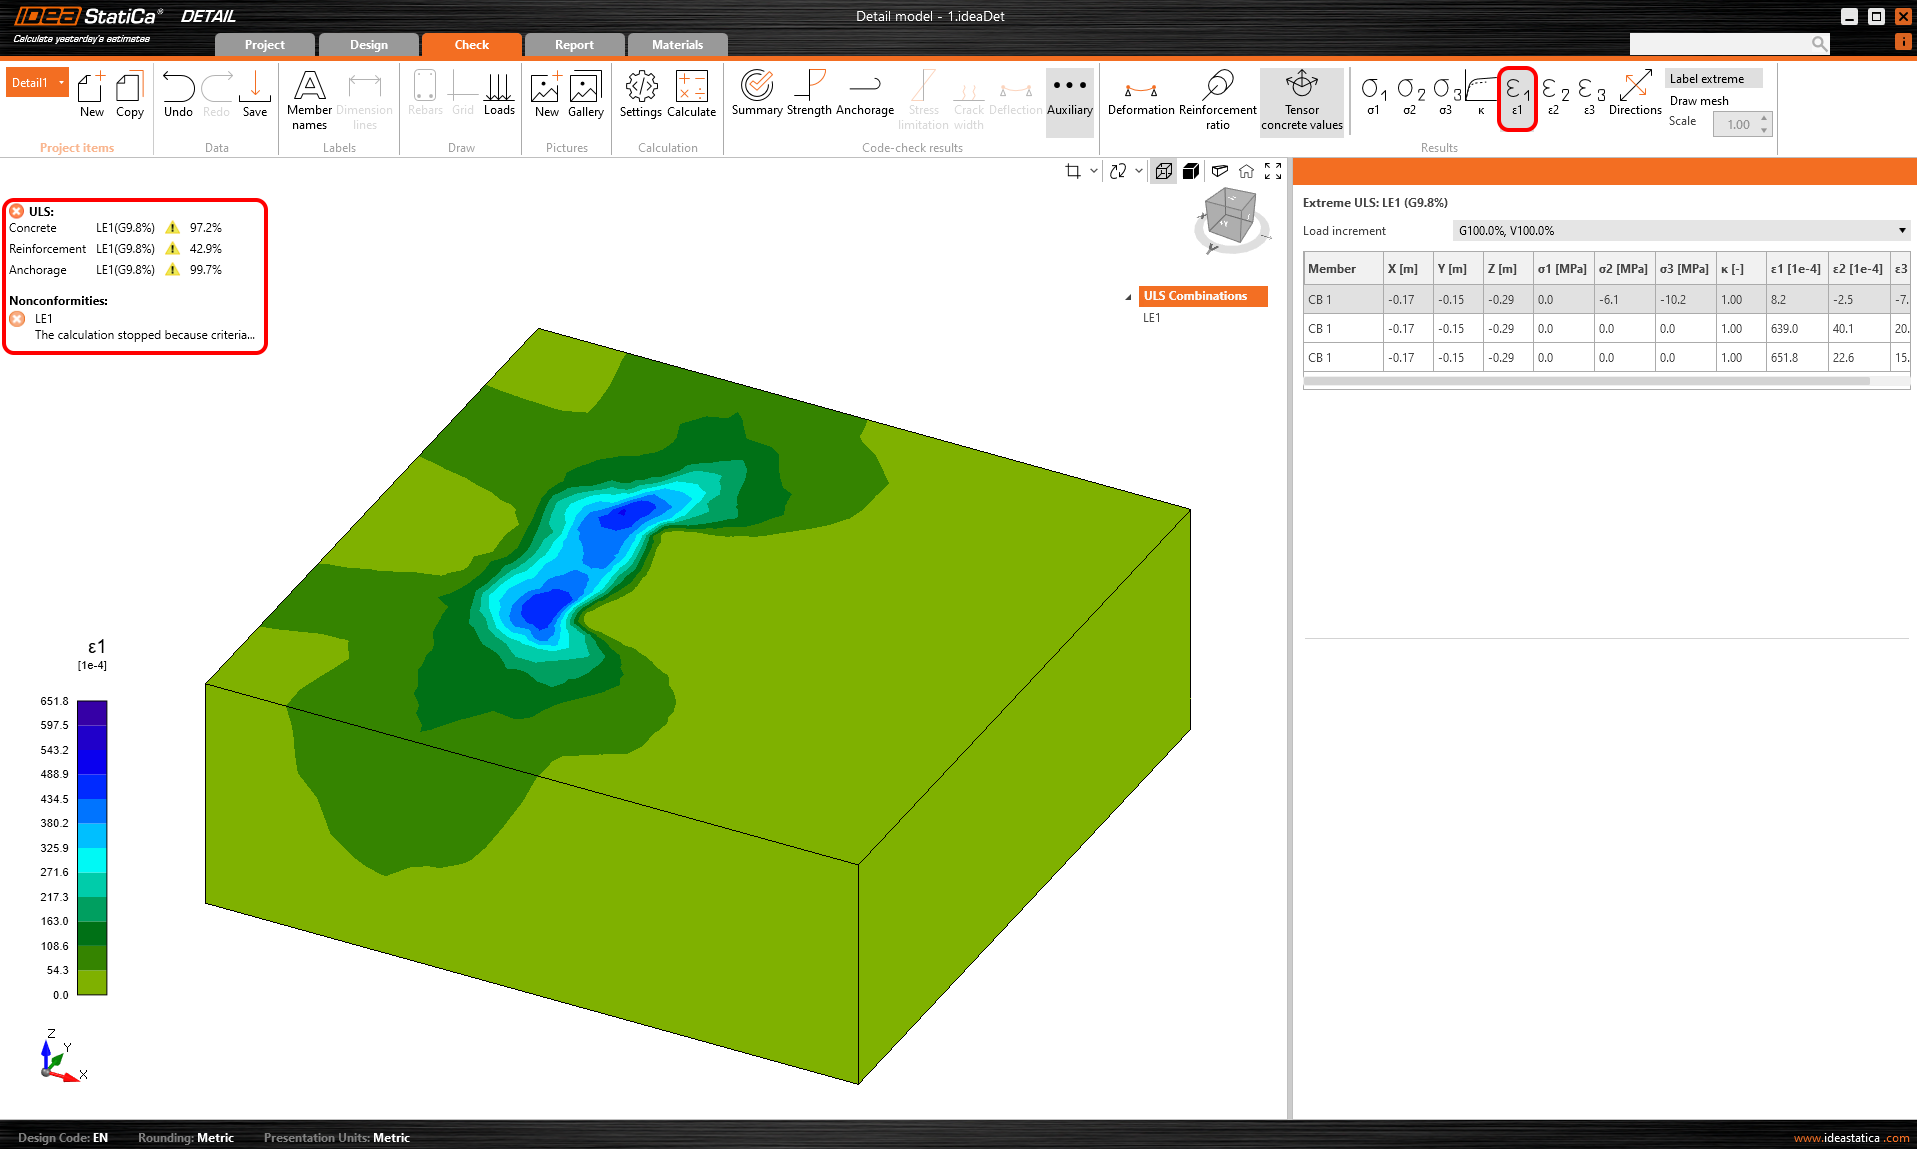
Now, let's calculate the model in the IDEA StatiCa Detail application and we make the first comparison with the Eurocode procedure.
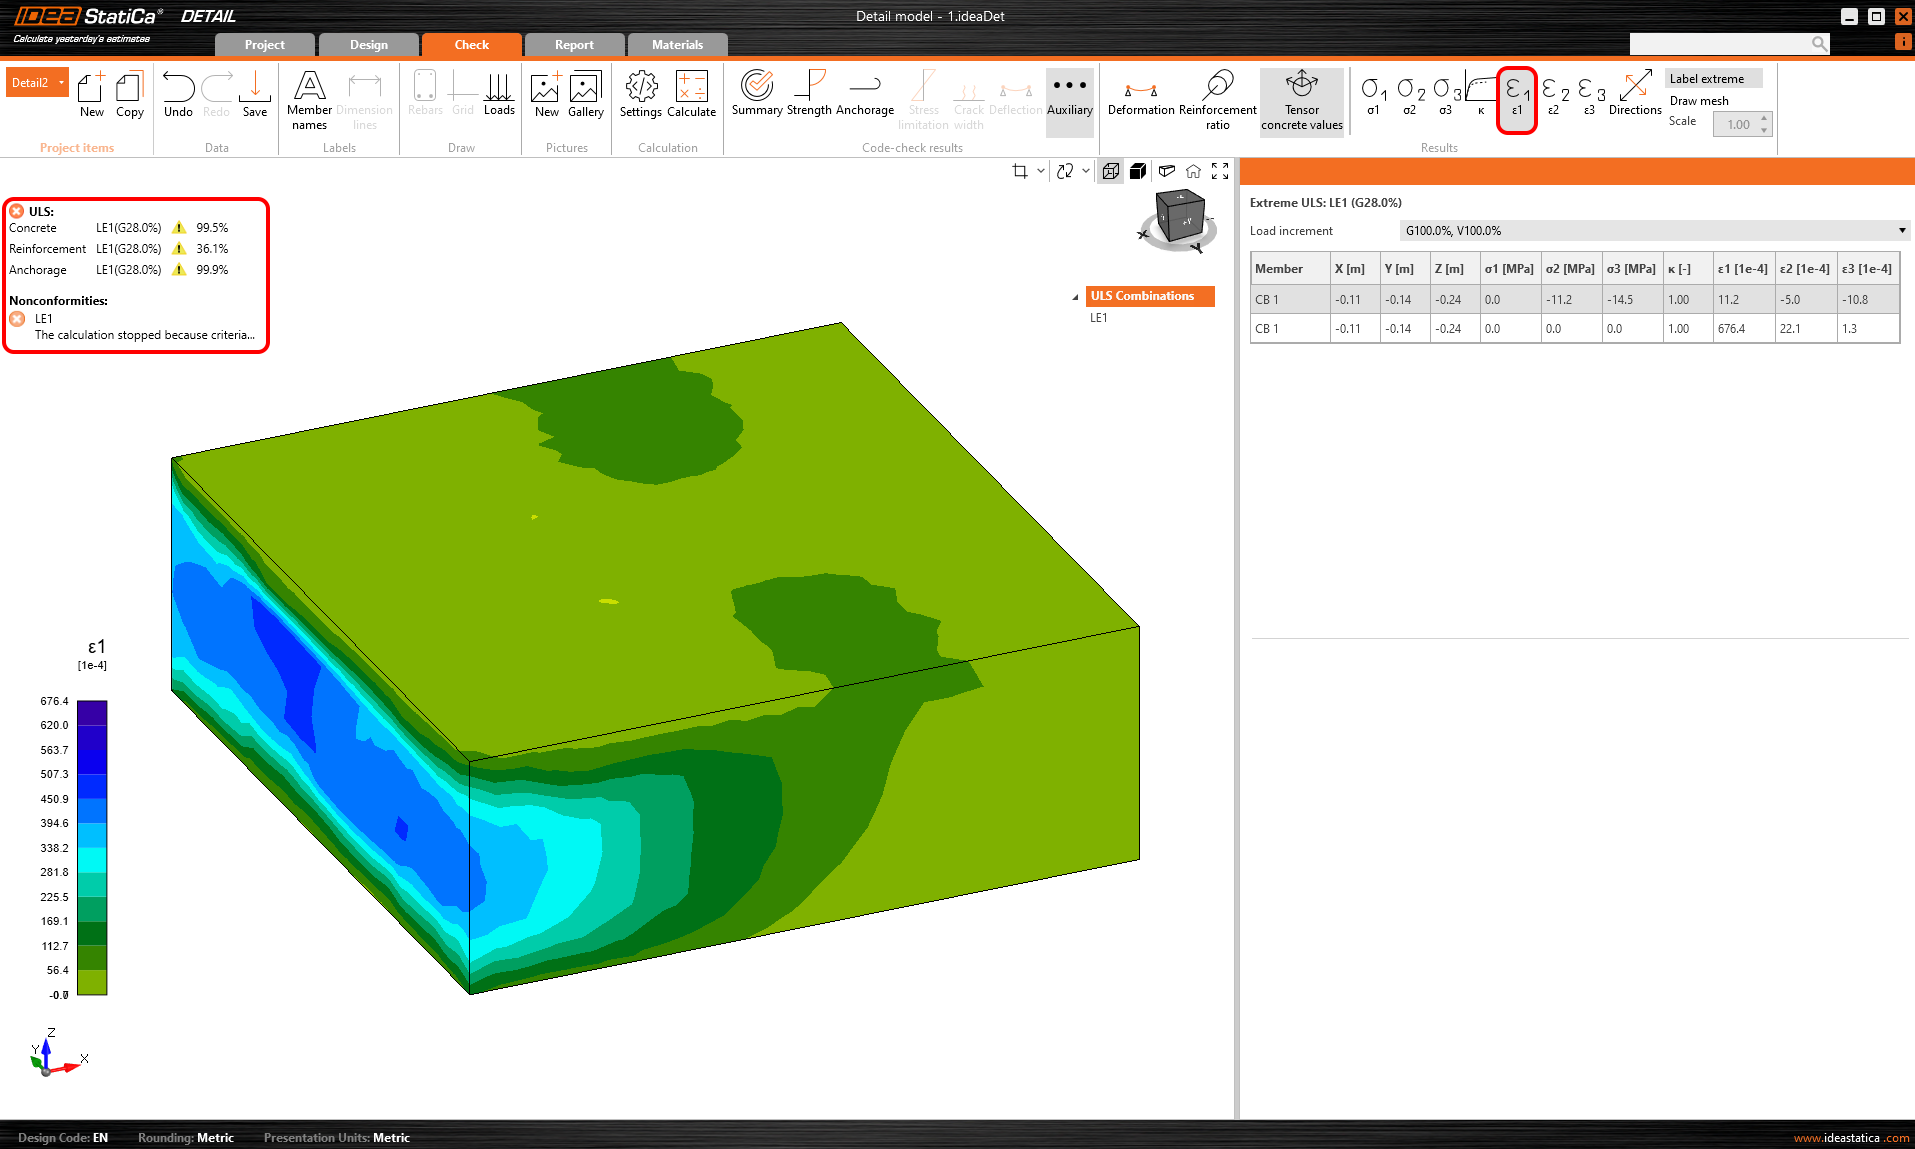
\[ \textsf{\textit{\footnotesize{Fig. 4\qquad Plain concrete results in IDEA StatiCa Detail}}}\]
Note: Since it is not allowed in the program to run the calculation without reinforcement, negligible concrete reinforcement was added to the model in the bottom corner. The results that are shown for the reinforcement and anchorage are therefore relative to this insert and are therefore irrelevant.
The result may be surprising because only 9.8% could be applied to the model before the stop criteria for the calculation were reached. This is much less than what comes out according to the formula-based approach defined above.
However, the reason is obvious, the concrete model in Detail has no tensile strength. This is one of the main assumptions of the calculation. It follows that correct and non-misleading results can only be obtained for models that are properly reinforced, according to the detailing rules in Chapter 8 of EN 1992-1-1.
Read more about the main assumptions of the calculation and stop criteria in the Theoretical background.
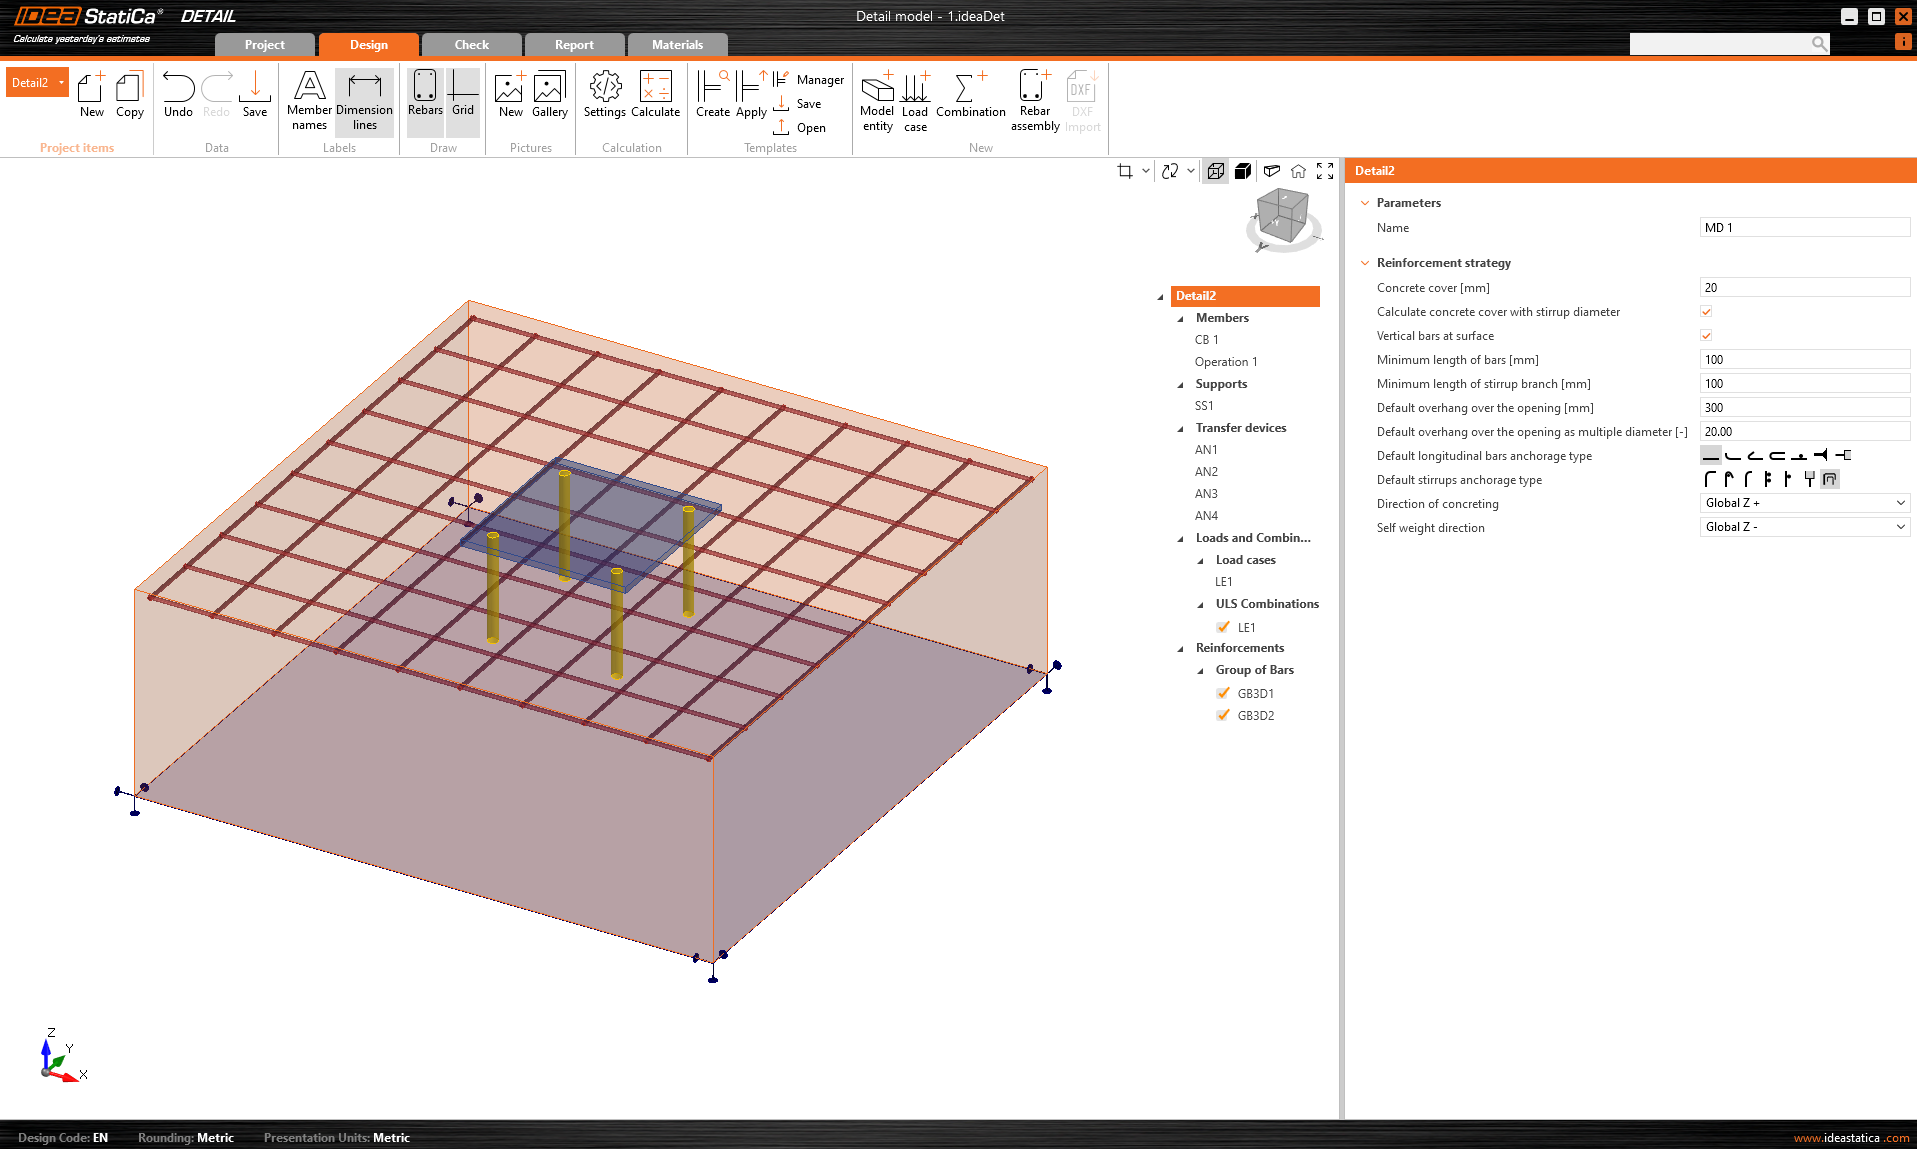
OK, so it's clear that we need to add reinforcement. In the following picture, the reinforcement is applied only to the top surface, which should have only a minimal impact on the load-bearing capacity because there is no vertical reinforcement to transfer the vertical components and bring the system into equilibrium (remember that concrete has zero tensile strength).
\[ \textsf{\textit{\footnotesize{Fig. 5\qquad Incorrect reinforcement only at the top surface without any vertical bar}}}\]
\[ \textsf{\textit{\footnotesize{Fig. 6\qquad Incorrectly reinforced concrete results in IDEA StatiCa Detail}}}\]
Again, we see that the transmitted force is not large. Some improvement can be observed, but the full carrying capacity of the formula-based approach has not been achieved. You may be asking why it was possible to apply any load at all to the model when the concrete does not act in tension. The reason is that, for the sake of numerical stability, it is necessary to define a very small tensile strength for the concrete. All parameters, including the residual tensile strength mentioned above, are set to make the results for reinforced concrete as accurate as possible. For this reason, the results for plain concrete or for concrete that is not reinforced according to the detailing rules are misleading.
The next logical step is to show the results of properly reinforced concrete. For this, we also increase the load so that the Concrete breakout resistance of the anchor in tension (EN 1992-4 - 7.2.1.4) is not satisfied. The tensile capacity of the anchors will be close to its maximum, as will the capacity of the other components of the model.
\[ \textsf{\textit{\footnotesize{Fig. 7\qquad An insufficient EN 1992-4 - 7.2.1.4 check}}}\]
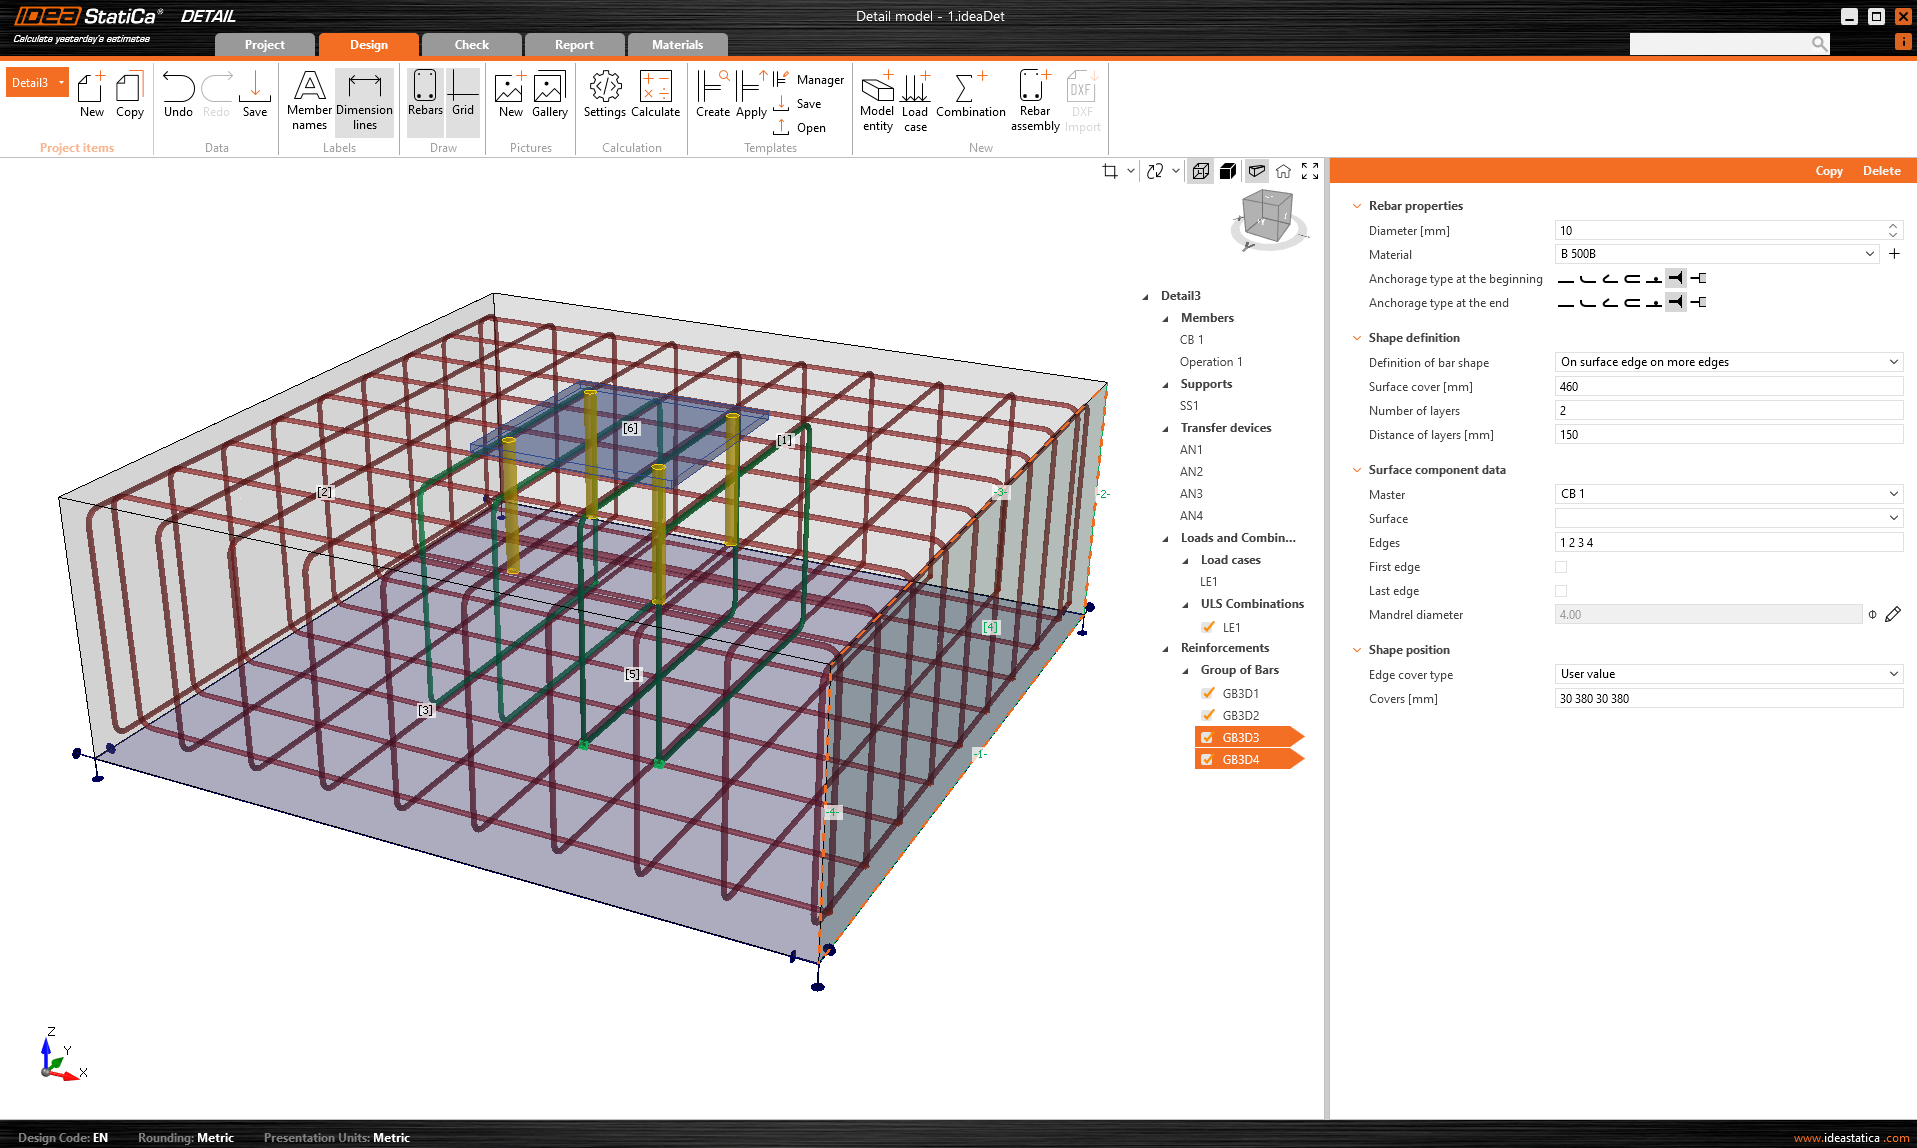
Closed stirrups are added around the entire surface of the concrete block. The stirrups are also added evenly around the anchors. The diameter of all stirrups is 10 mm.
\[ \textsf{\textit{\footnotesize{Fig. 8\qquad A correctly reinforced concrete block in IDEA StatiCa Detail}}}\]
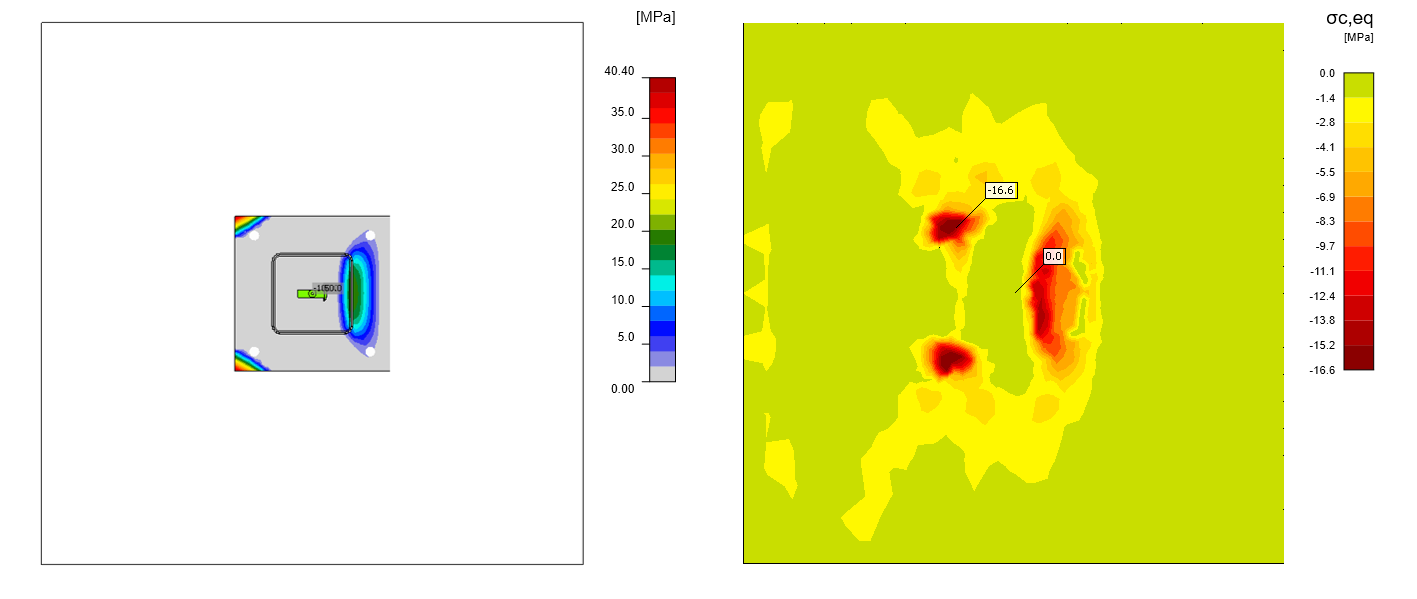
Now, let's examine the results. First, compare the contact stresses in IDEA StatiCa Connection, where the concrete is modeled as an elastic Winkler subgrade (see here - Winkler subsoil model for foundation pad), and in IDEA StatiCa Detail, where the concrete model is nonlinear with reinforcement. We compare with the so-called Equivalent Principal Stress. For a more detailed description, see the Theoretical background.
\[ \textsf{\textit{\footnotesize{Fig. 9\qquad A comparison of surface stresses of the linear model from IDEA StatiCa Connection and nonlinear model from IDEA StatiCa Detail}}}\]
It can be seen that the results tend to behave identically. However, we can observe the influence of the plastic (more accurate) behavior of the concrete in the results from the Detail application.
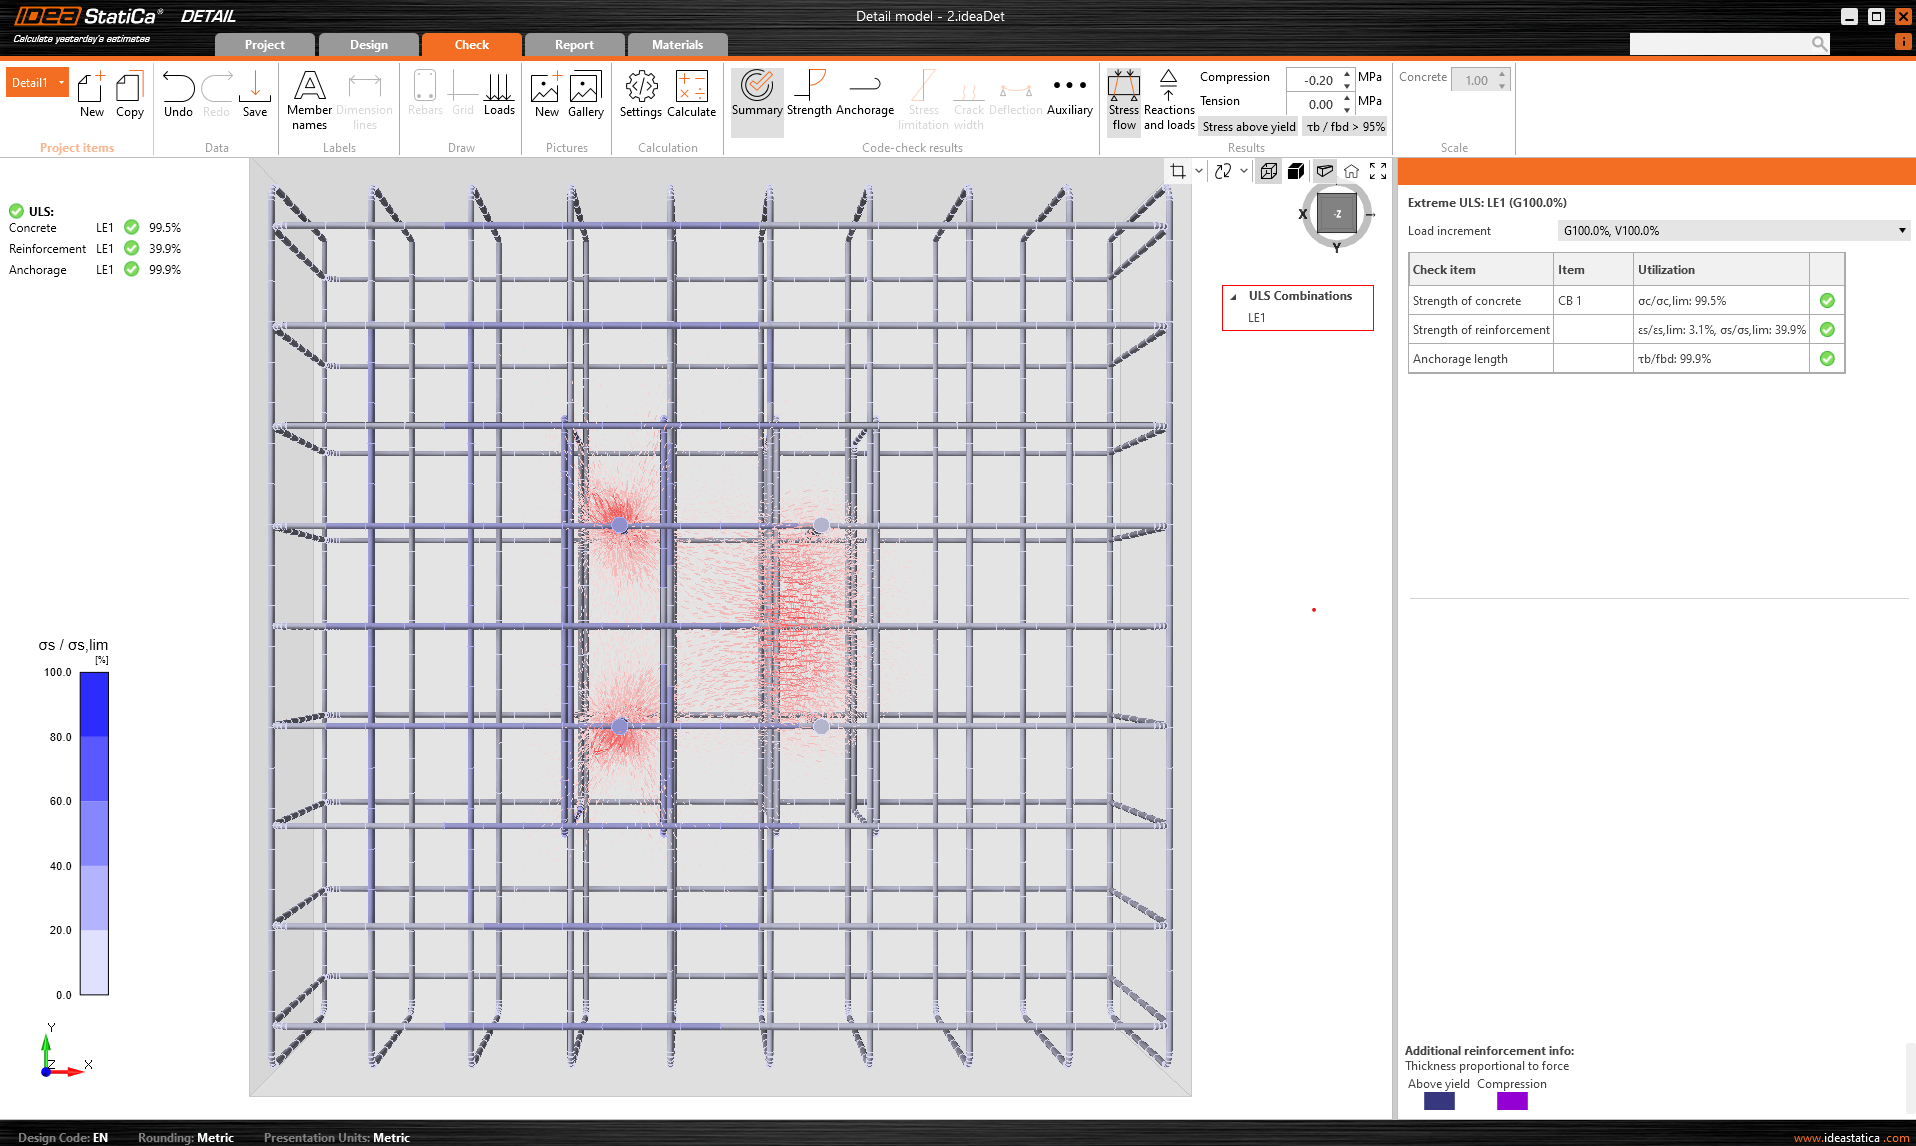
Looking closely at the directions of the principal compressive stresses in the concrete, we can notice the load on the anchors is redistributed to the individual legs of the stirrups.
\[ \textsf{\textit{\footnotesize{Fig. 10\qquad Stress flows in concrete – top view}}}\]
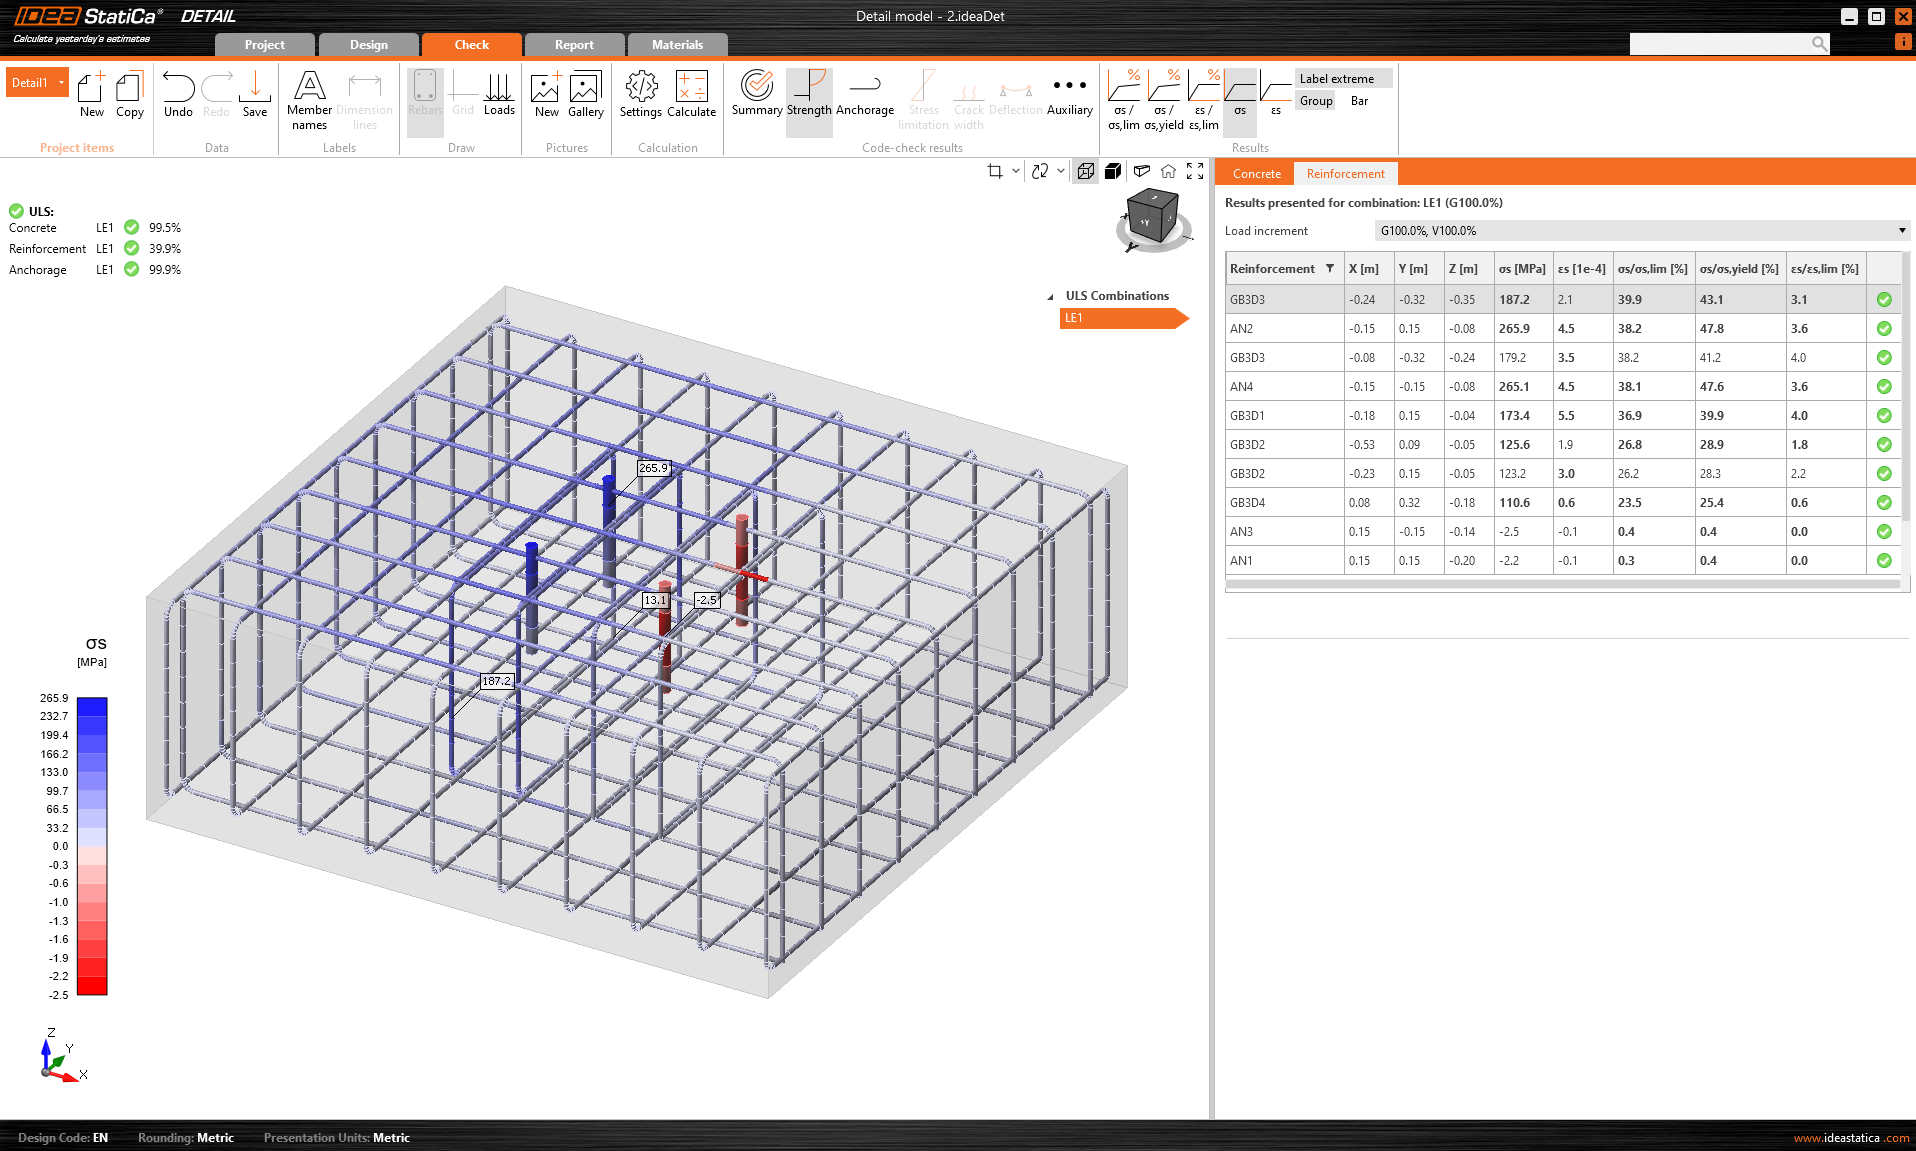
Alternatively, we can display the stress in the reinforcement. The values obtained show that the additional shear reinforcement is more than sufficient.
\[ \textsf{\textit{\footnotesize{Fig. 11\qquad Stress in reinforcement}}}\]
Redistribution from anchors to concrete
The previous paragraph shows that the biasing behavior of the computation is fine and, in particular, that it conforms to the defined assumptions. We now look at the actual mechanism of redistribution of tensile stresses in the anchors to the surrounding reinforcement. We're not going to focus on the bond between the anchor and the concrete. It has been verified here: Unit test: Anchoring
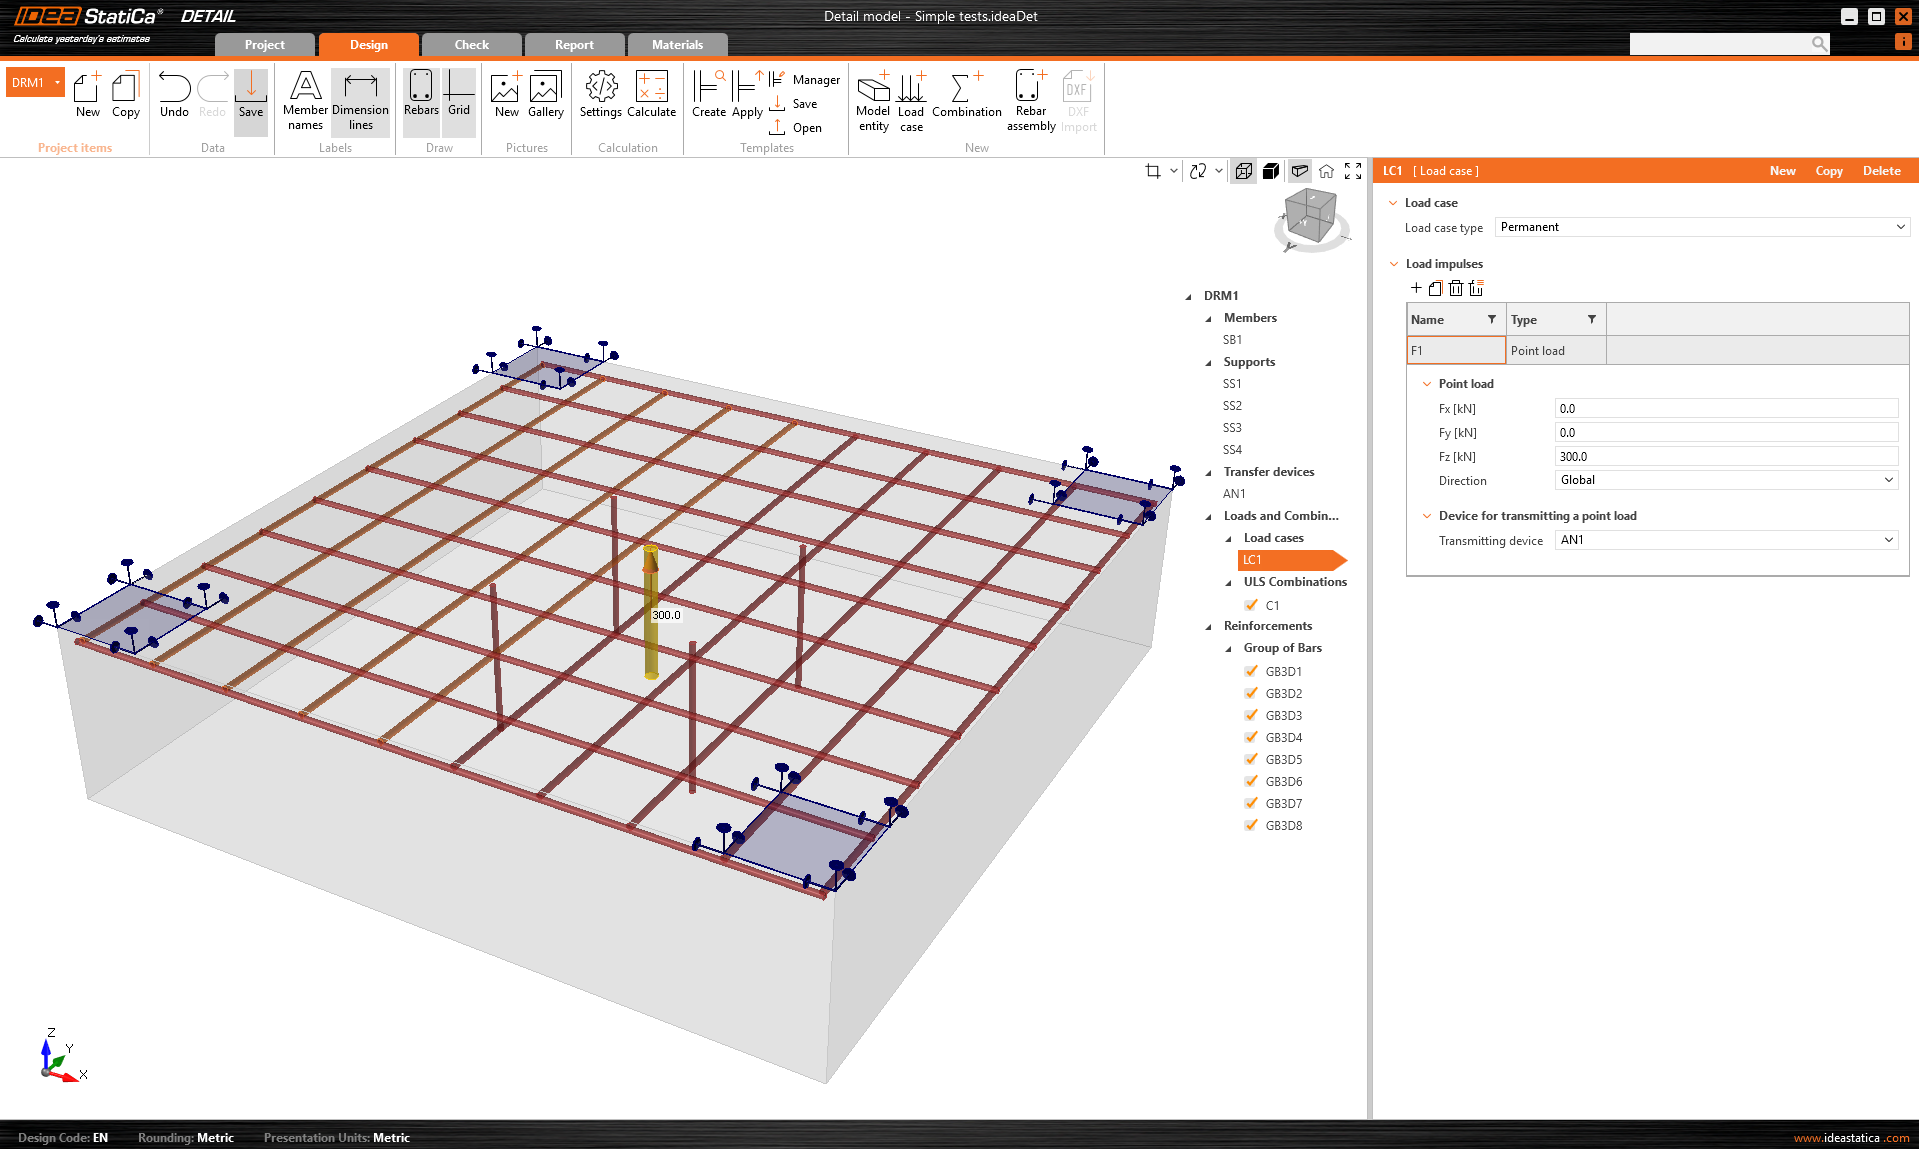
Since the example given in the previous section is complex, for example, it contains a combination of compressive and bending loads on the base plate, which causes a significant influence of the pressure fields flowing from the anchor to the leg of the stirrup (described in EN 1992-4 Cl. 7.2.1.4 (7) as an effect of a compression force between fixture and concrete in cases of bending moments with or without axial force), we simplify the situation to a single tensioned anchor.
\[ \textsf{\textit{\footnotesize{Fig. 12\qquad Simple mode of one anchor}}}\]
The model is 0.3 m high and is supported on the upper surface by four rectangular surface supports. It is reinforced on the upper surface with a 10 mm profile by the spacing of 135 mm and supplemented with four vertical reinforcements of a 10 mm profile. In the center of the block is a 0.22 m long anchor of a 22 mm profile with a Bond strength set at 16 MPa. All reinforcement, including the anchor, is made of B500B steel and the concrete grade is C40/50.
Partial coefficients γ for materials are set to 1.0. All vertical reinforcement has the Perfect bond anchorage type set.
From the results, it can be observed that the stress flow from the anchor to the shear reinforcement tends to match reality.
\[ \textsf{\textit{\footnotesize{Fig. 13\qquad Stress flow from the anchor to the vertical reinforcement}}}\]
However, let us see if the load has been transferred correctly in terms of magnitude. The calculation was stopped at 530 MPa at the anchor because of the max slip criterion.
\[ \textsf{\textit{\footnotesize{Fig. 14\qquad Stress in vertical reinforcement}}}\]
If we recalculate the maximum stresses on the vertical reinforcement and on the anchor, we find that a force of 201.4 kN was applied to the anchor and 4 x 41 = 164 kN to the anchors. This may seem like an incorrect result. However, a closer look shows that part of the force was redistributed directly to the supports. Therefore, this model cannot be used to accurately demonstrate the correctness of the force transfer mechanism from the anchors to the shear reinforcements.
Partial coefficients γ for materials are set to 1.0. All vertical reinforcement has the Perfect bond anchorage type set.
Now, we will use slightly more complicated models where we will avoid the direct redistribution of forces to the supports.
\[ \textsf{\textit{\footnotesize{Fig. 15\qquad Modified model}}}\]
Again, the reinforcement is specified at the upper surfaces with a profile of 10 mm but over a distance of 100 mm. The anchor is 22 mm in diameter with a length of 0.22 m. The material classes are the same as in the previous case.
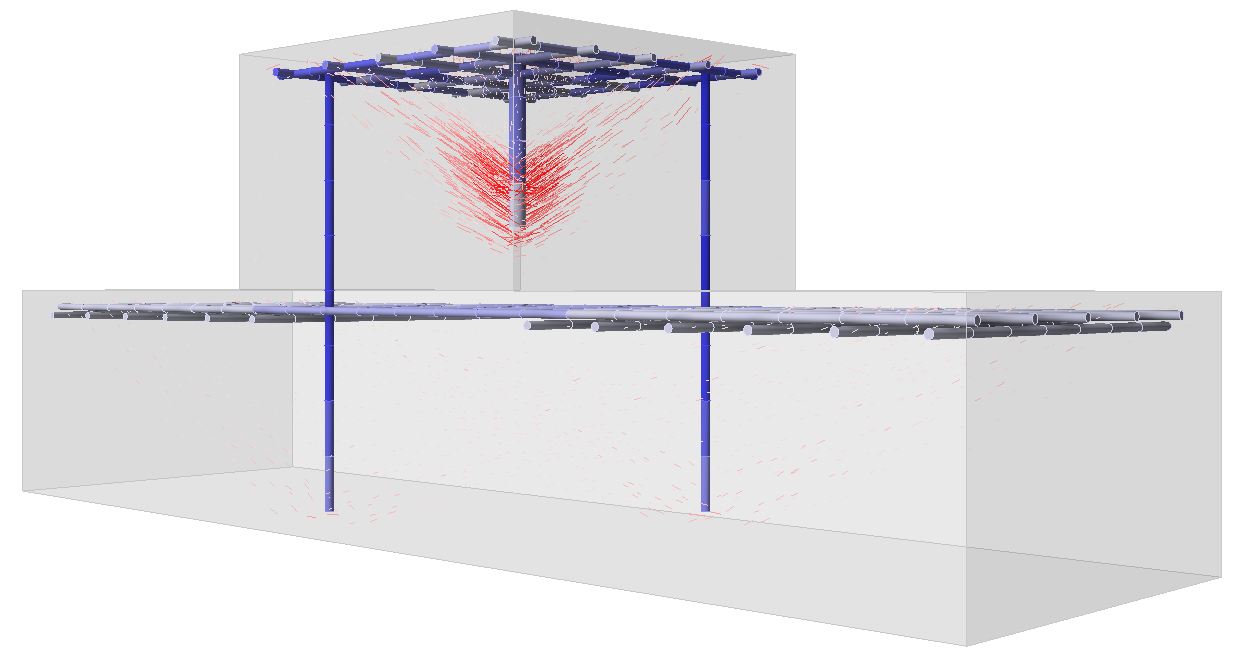
Looking at the stress flows, it can again be assessed that they tend to correspond to reality.
\[ \textsf{\textit{\footnotesize{Fig. 16\qquad Stess flow in the modified model}}}\]
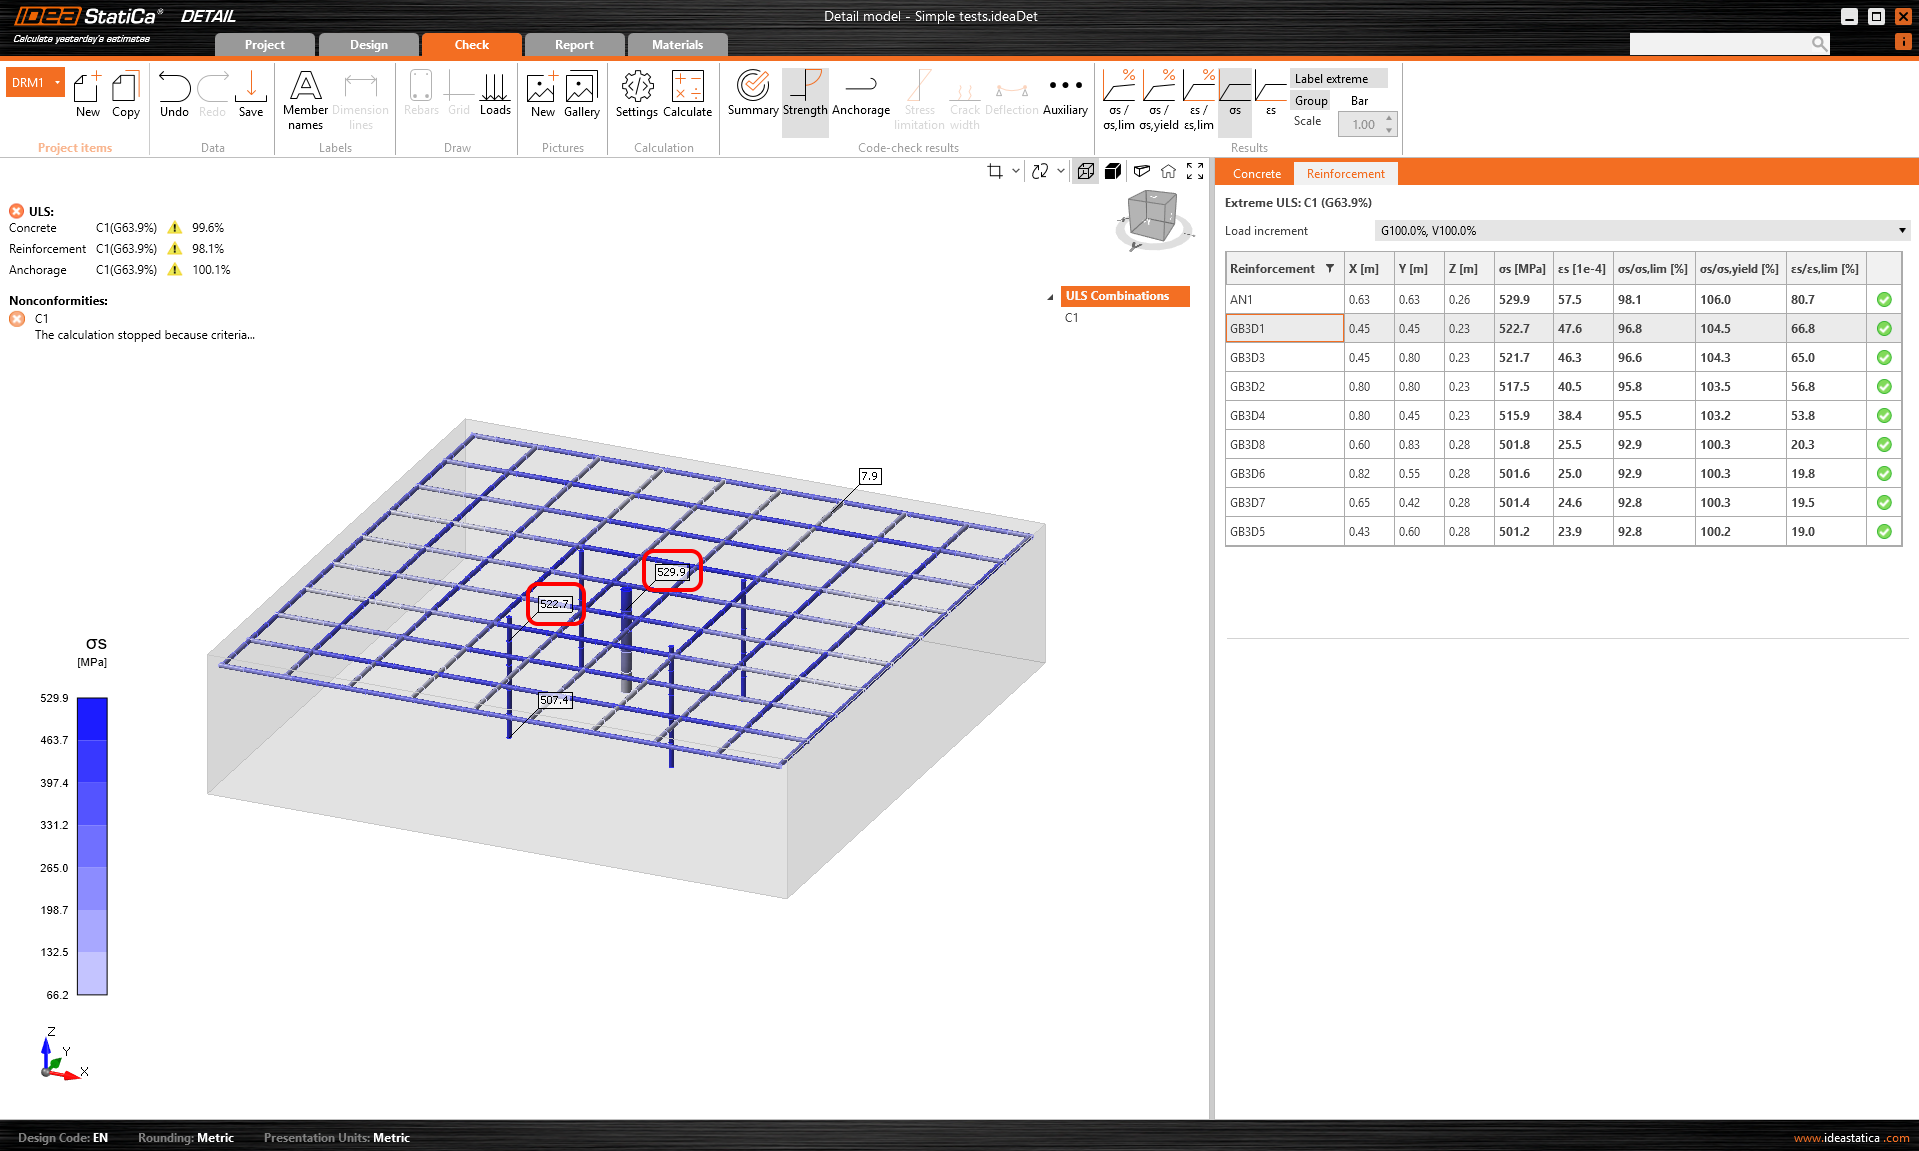
But let us look at the total forces that are transferred from the anchors to the vertical reinforcements.
\[ \textsf{\textit{\footnotesize{Fig. 17\qquad Reinforcement stress in the modified model}}}\]
This time, the calculation stopped at an applied force of 160 kN per anchor due to the maximum strain of the vertical reinforcements. After recalculating the stresses on the reinforcements, we find that there is a force of 40 kN in each vertical reinforcement.
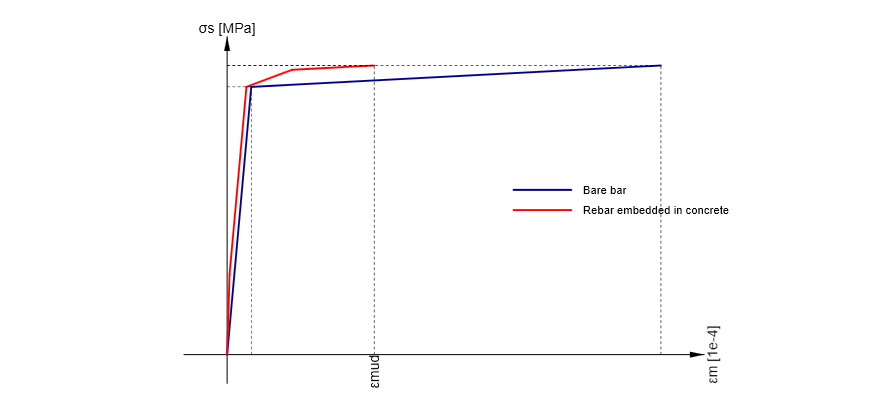
You may wonder why the calculation did not stop at 540 MPa, which is the strength limit of the reinforcement. The answer is the Tension stiffening phenomenon, which modifies the reinforcement stress-strain diagram.
\[ \textsf{\textit{\footnotesize{Fig. 18\qquad Stress-strain diagram for reinforcement used in IDEA StatiCa Detail}}}\]
More information can be found here: IDEA StatiCa Detail – Structural design of concrete 3D discontinuities
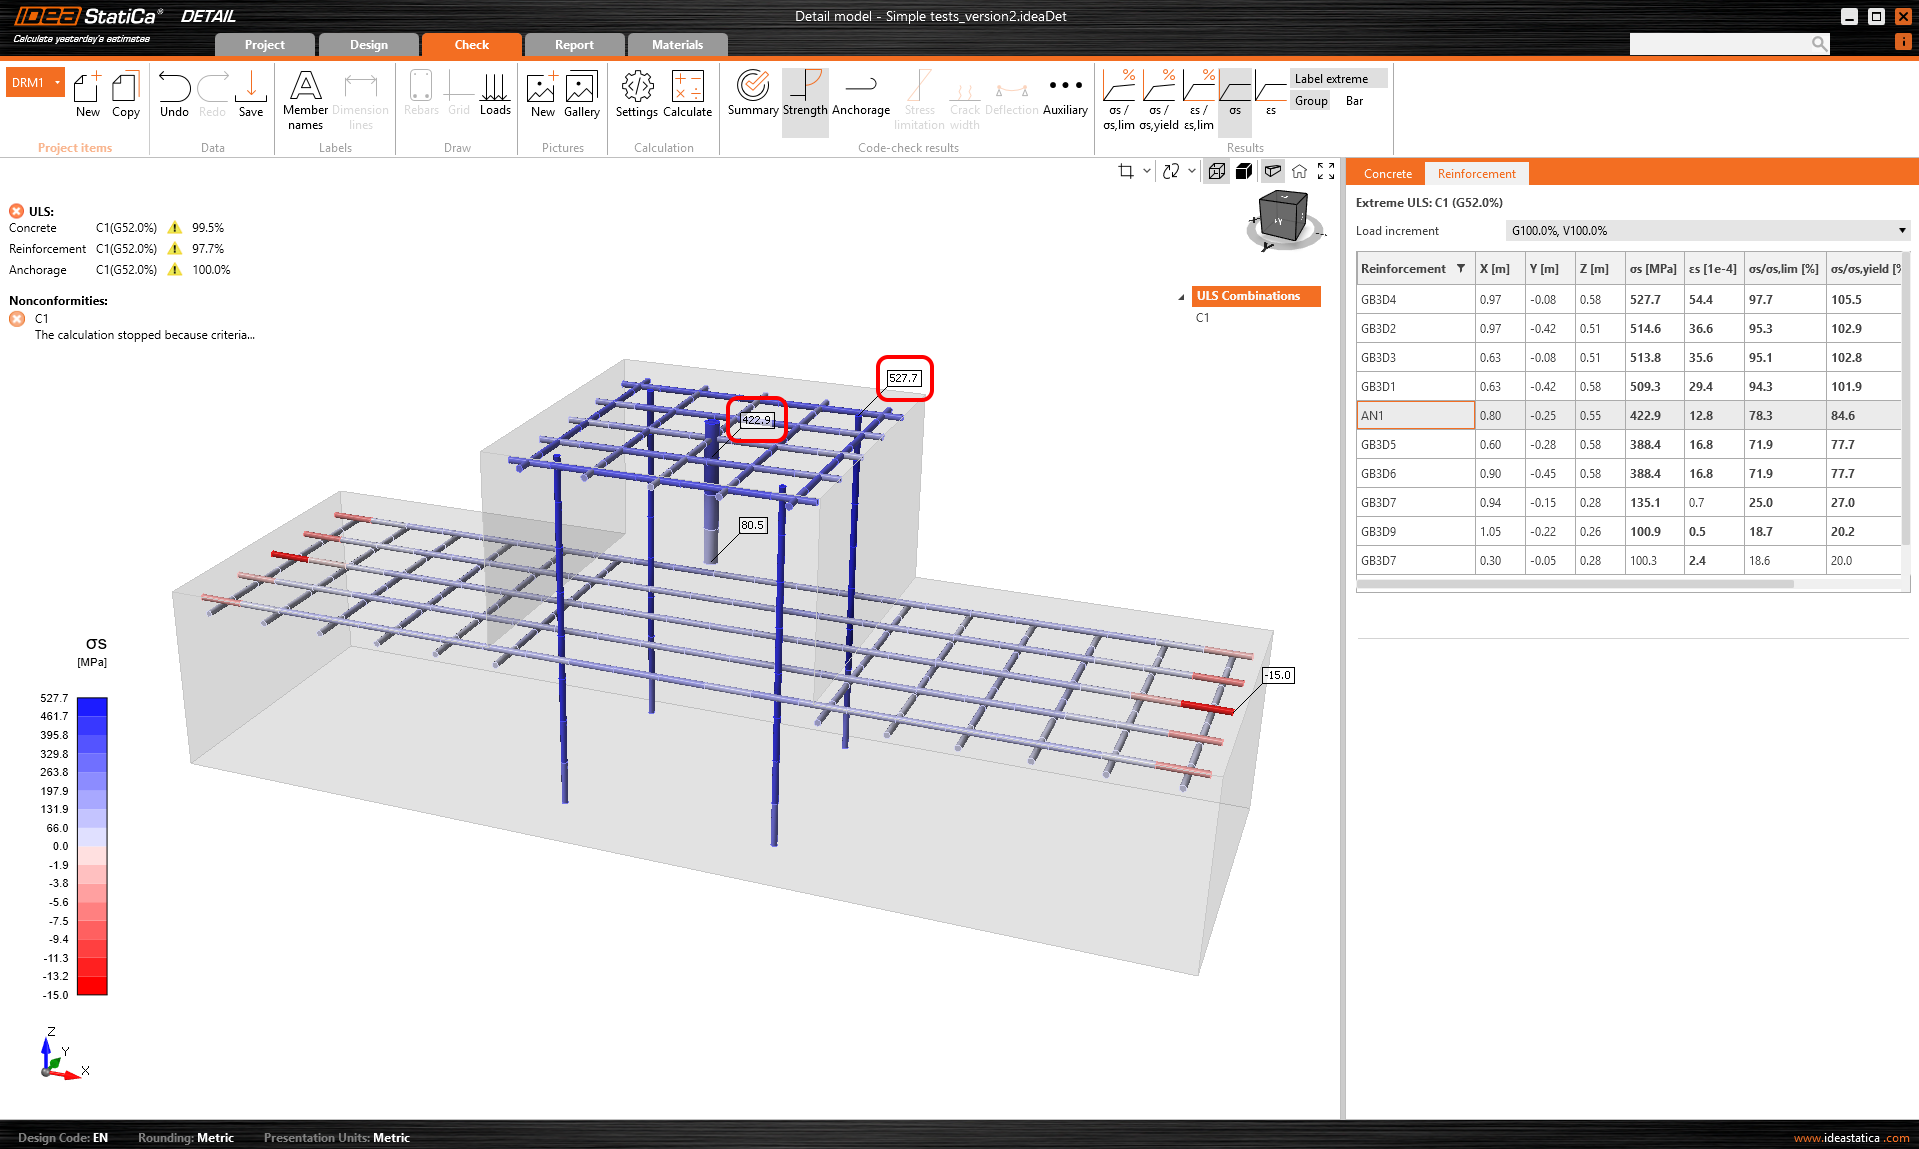
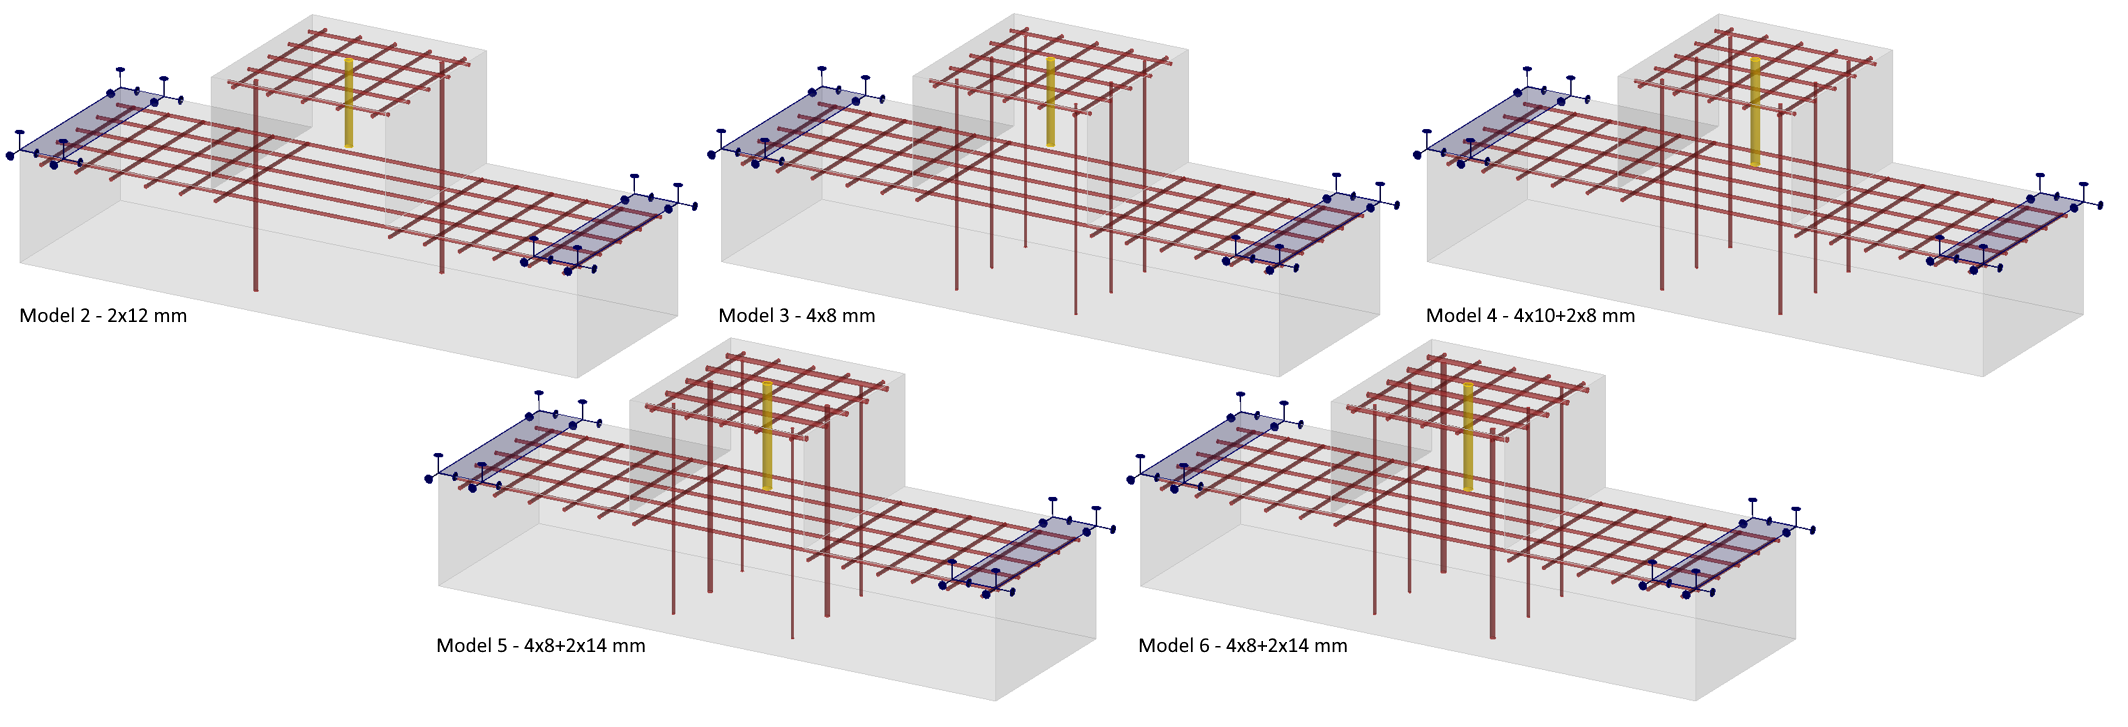
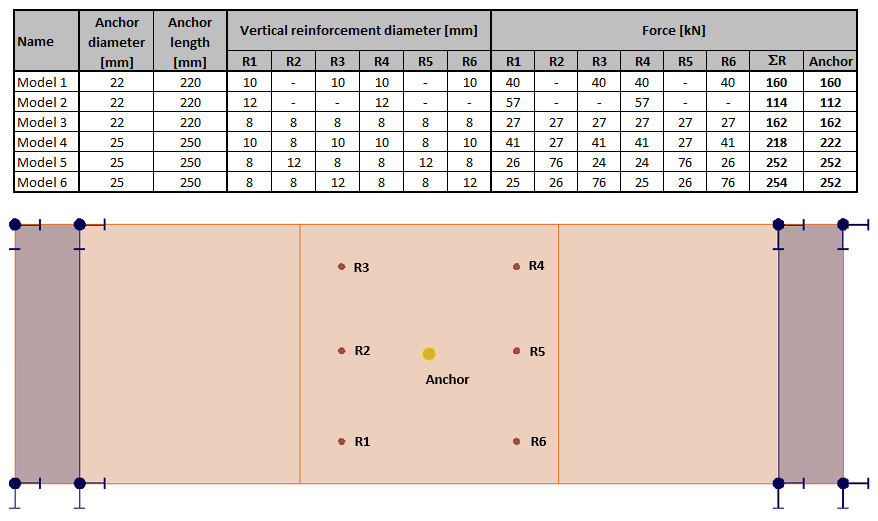
With this example, it has been shown that all the force has been transferred from the anchor to the vertical reinforcement and further to the supports. We will now check the result on other examples where the vertical reinforcement will be unevenly distributed.
\[ \textsf{\textit{\footnotesize{Fig. 19\qquad Other investigated models with unevenly distributed vertical reinforcement}}}\]
The resulting table, including the designation of the vertical reinforcements, is presented below.
\[ \textsf{\textit{\footnotesize{Fig. 20\qquad Result table for all modified models}}}\]
For example, for Model 2, we can observe that the stress flows are clearly governed by the stiffnesses in the model. Since there are only two vertical bars in the model, the stress flow is automatically adjusted compared to Model 1.
\[ \textsf{\textit{\footnotesize{Fig. 21\qquad Stress flow in Model 2}}}\]
Conclusion
In this paper, we have compared the failure mechanism of concrete cone failure according to EN 1994-2 and 3D CSFM results. We have shown that, under the given assumptions, concrete does not act in tension and that modeling plain concrete in IDEA StatiCa Detail leads to misleading results at least. For properly reinforced concrete, we have shown that there is a transfer of forces from the anchors to the shear vertical reinforcement that significantly increases the load-carrying capacity of the element. The actual mechanism of force transfer from the anchor to the surrounding reinforcement was investigated and shown to be correct and reliable for both uniform and non-uniform reinforcement in the vicinity of the anchor.


