General description of ULS results in Detail application
In this section, we focus on the Strength and the Anchorage (ULS checks). Notice we have a new tab (Results) in the top ribbon after choosing one of the ULS checks.
On the left side, you can choose if you want to display results for an automatic extreme, a particular ULS combination, or increments. Remember that non-linear calculation is used (plastic strains are allowed for steel and concrete). And only ULS combinations or individual load cases are taken into account.
The next buttons are for switching between the current results.
Last buttons in the Results tab are used to edit the graphic output (drawing the mesh, scale of the view, or displaying the extreme).
Concrete
We can observe six possible results. Let's look at them one by one.
Stress check value
The first value presents the level of material utilization with respect to concrete strength. In other words, it shows the ratio of concrete stress and concrete strength. Read about how the limit values are determined in the following article.
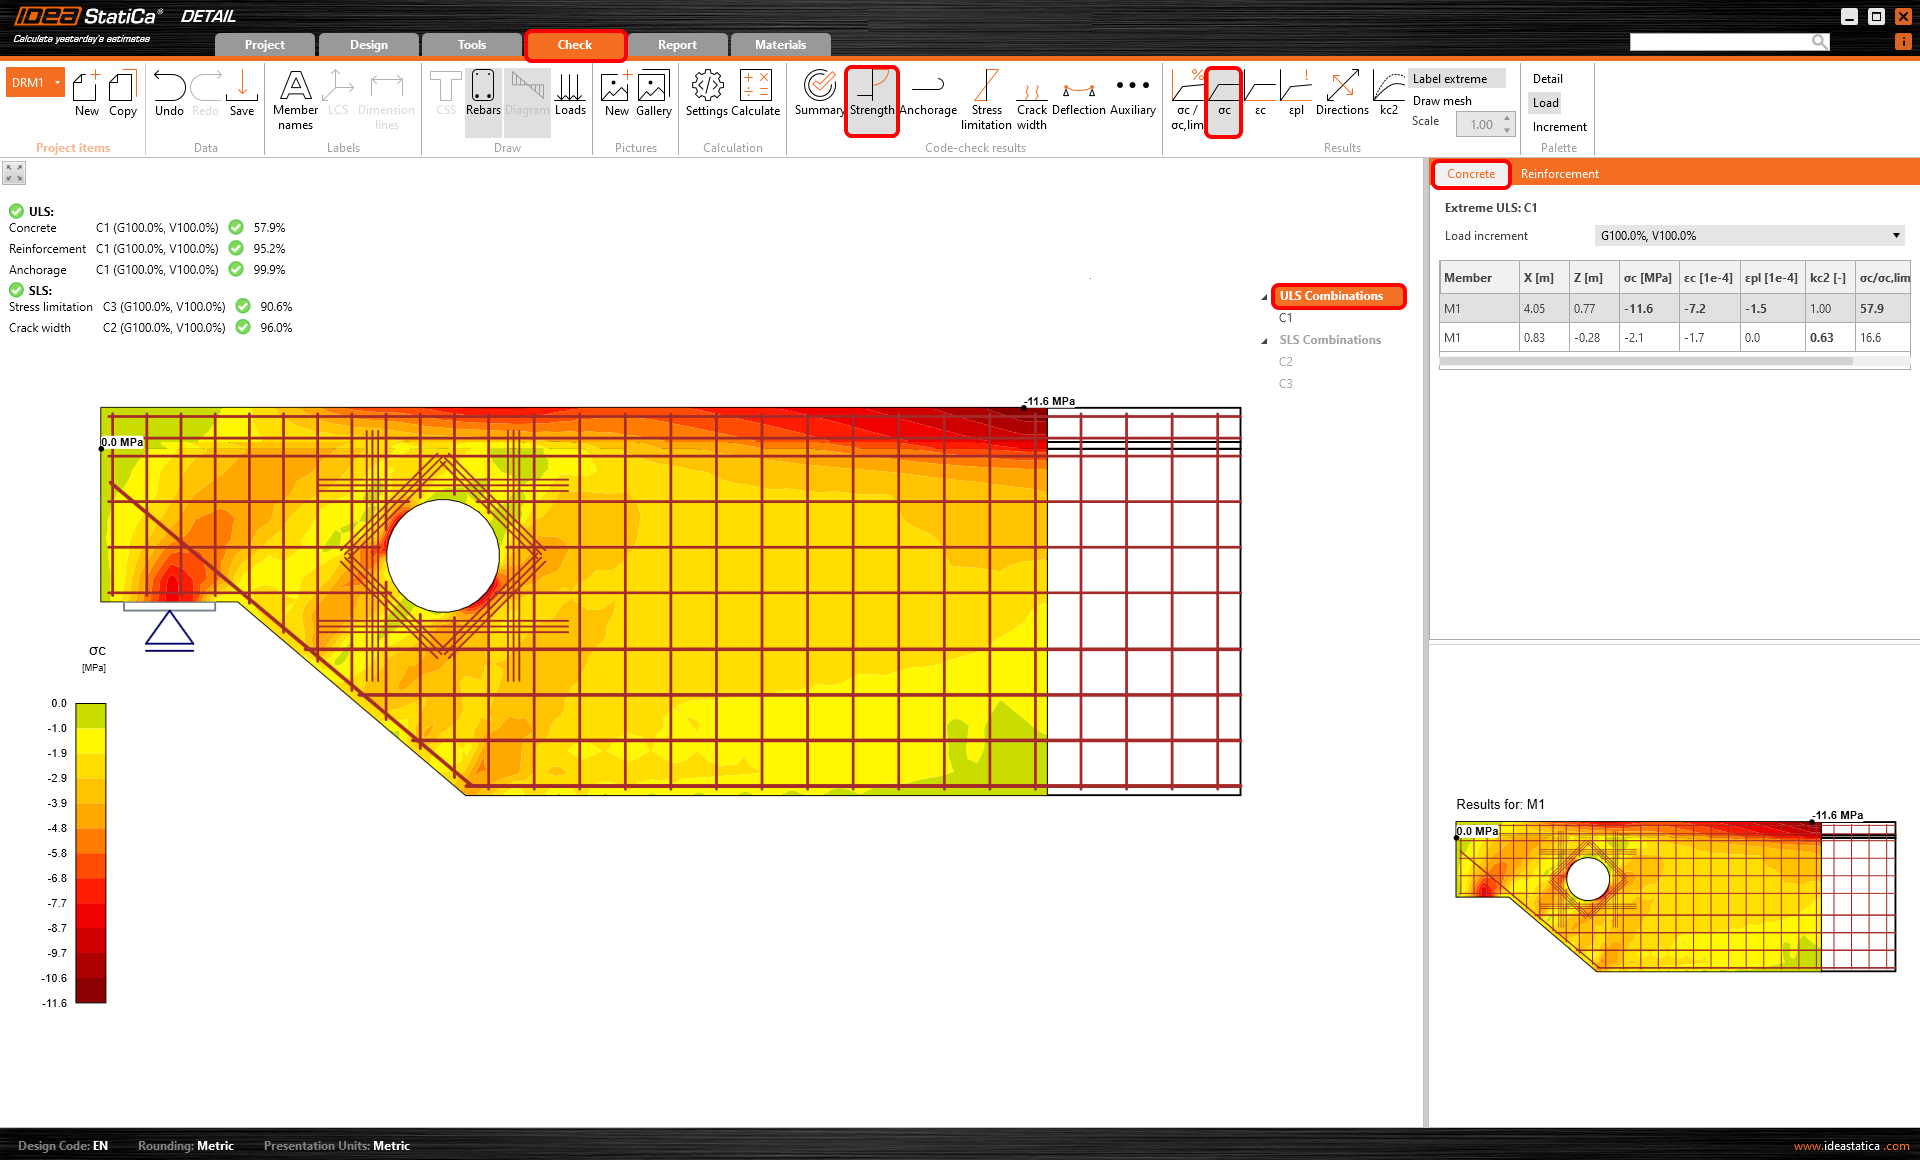
Compressive concrete stress
The next option is to display the distribution of concrete stress σc for an applied portion of the load. Also known as principal stresses σ2.
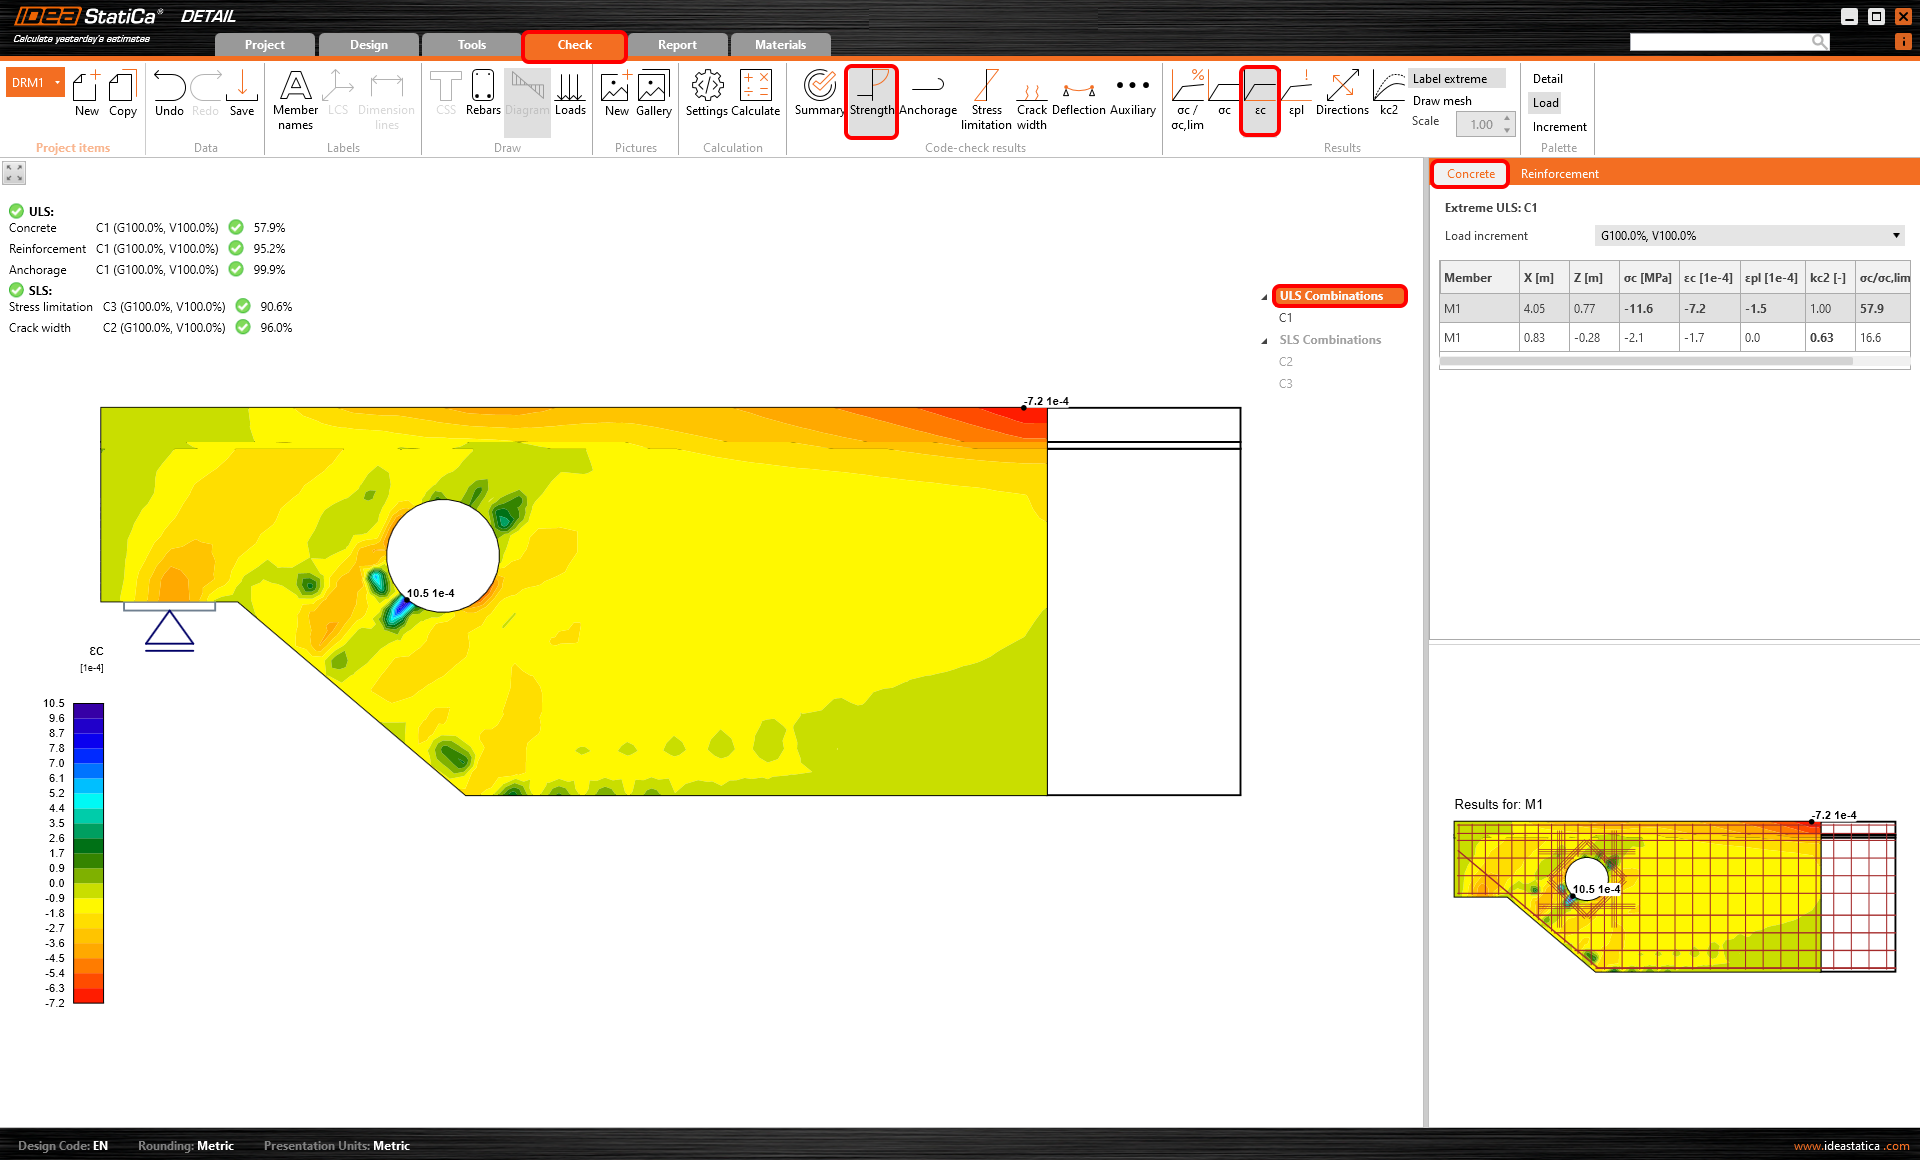
Compressive concrete strain
When you press the third icon in the result tab. The concrete strain εc for an applied portion of the load displays. Also known as principal strains ε2.
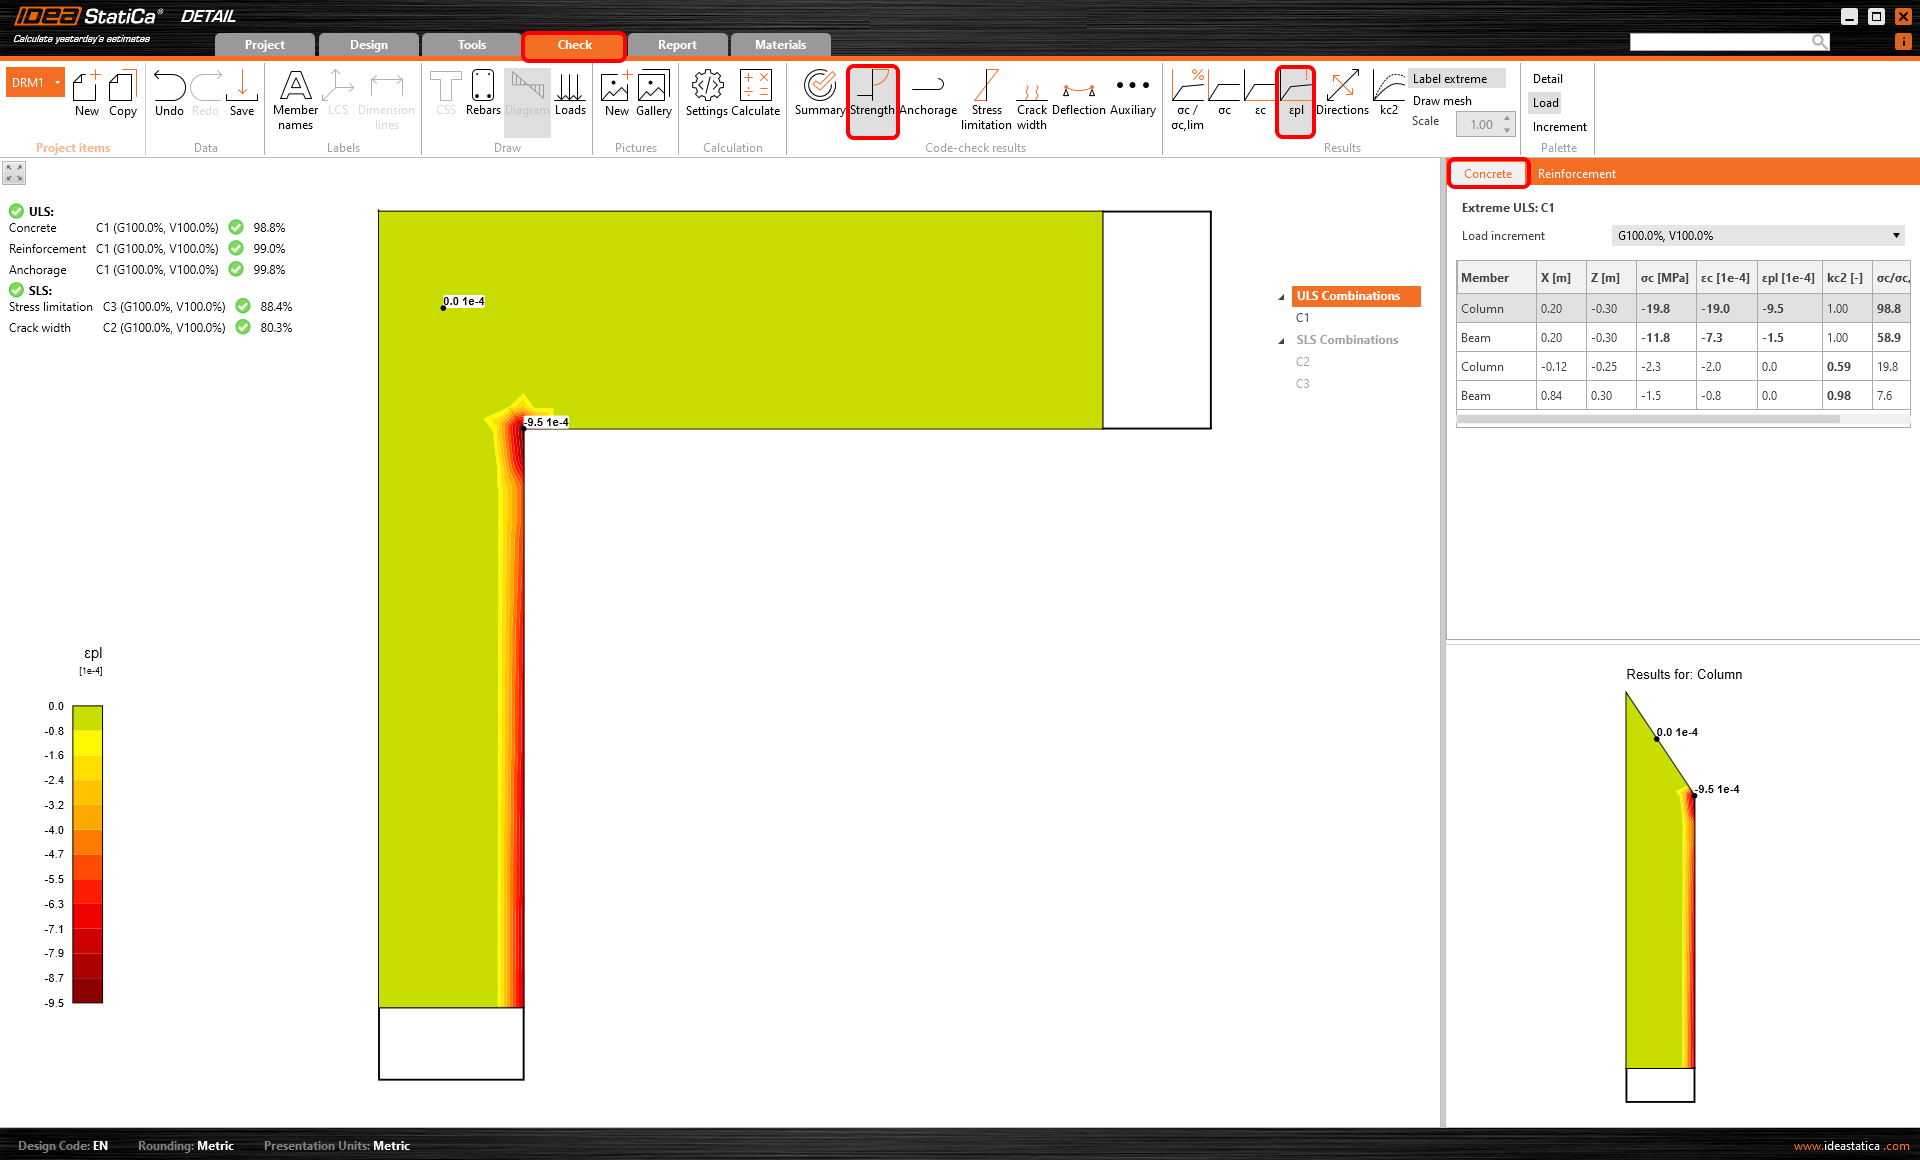
Compressive plastic strain of concrete
To observe the occurrence of plastic behavior in the concrete, continue to the Compressive plastic strain of concrete. You can display the areas where the concrete is in the plastic branch of the stress-strain diagram.
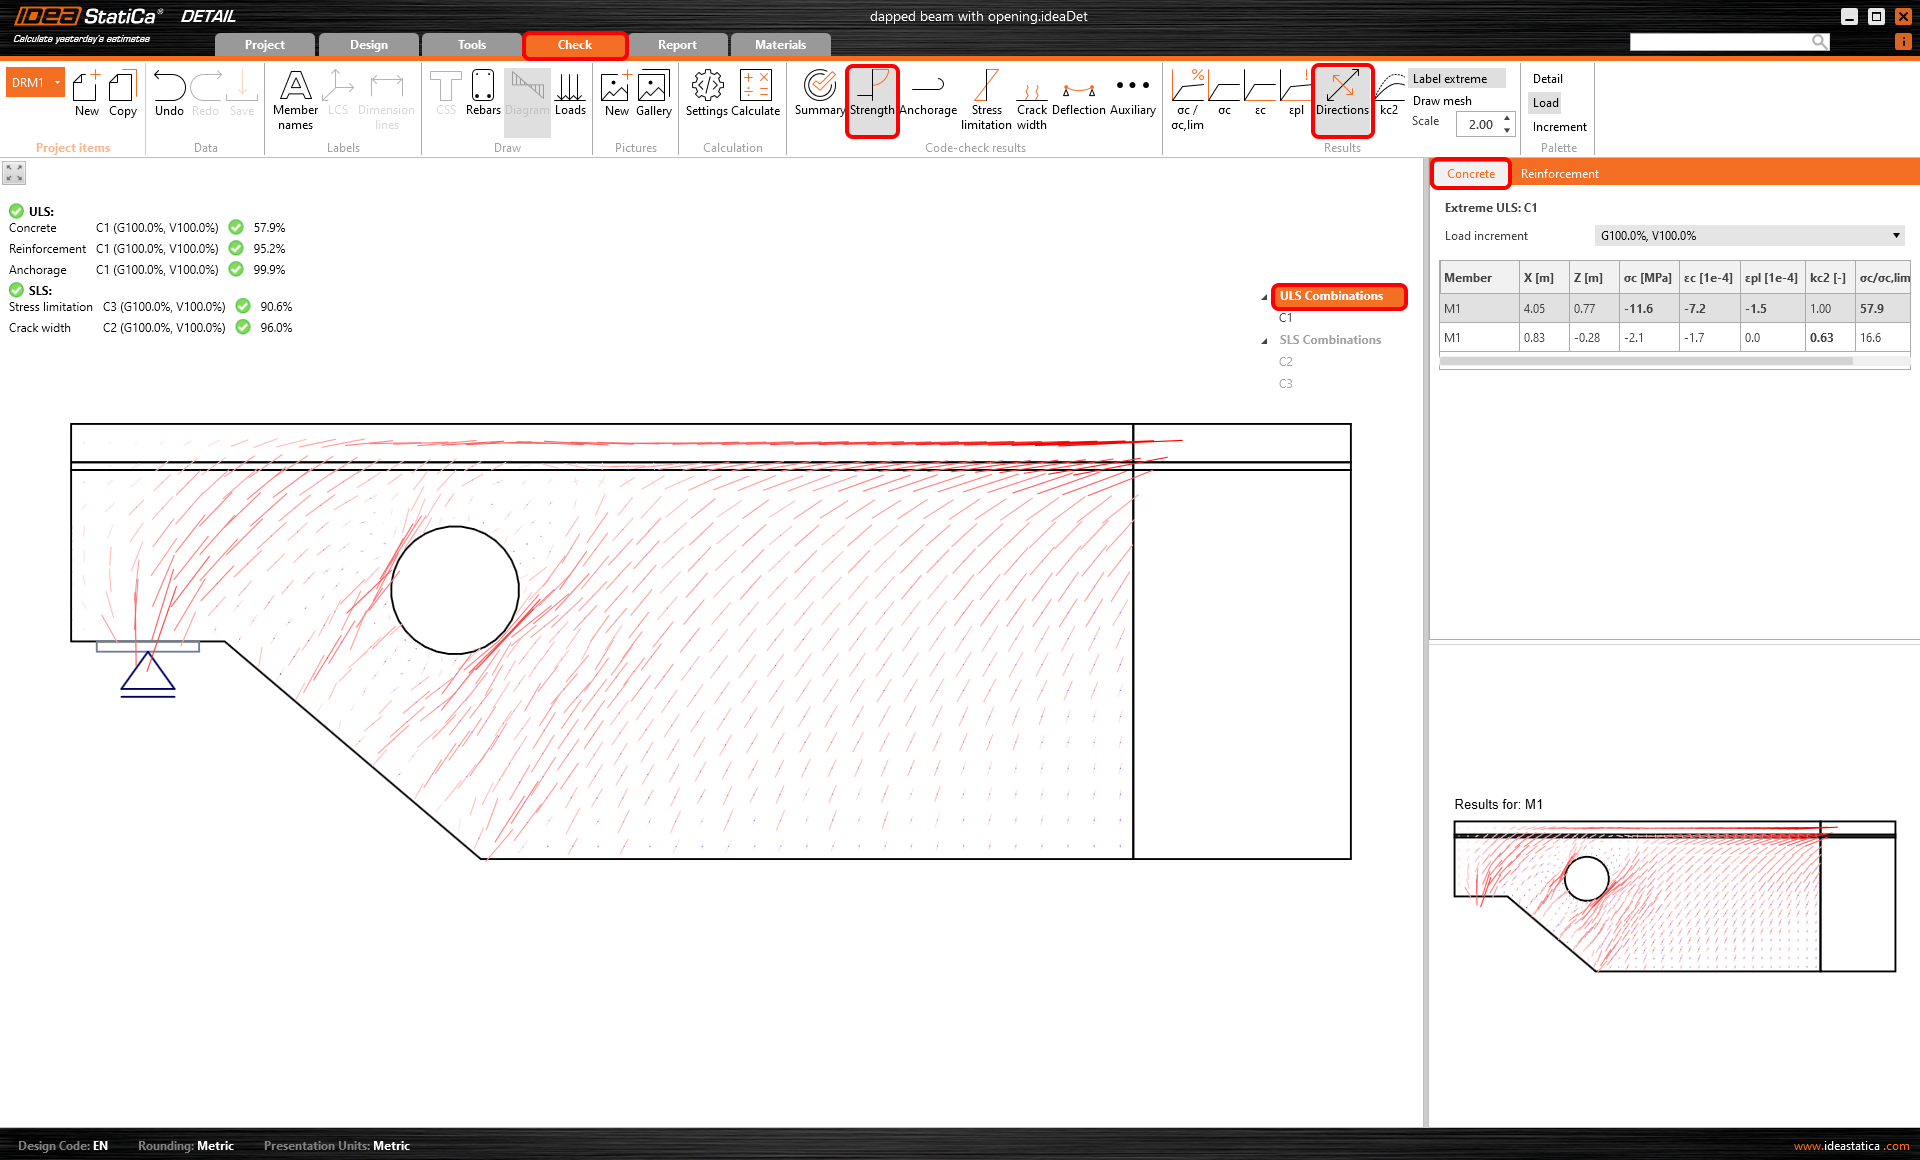
Direction of principal stresses
This functionality shows the direction of principal stresses. As the tension in concrete is excluded, only the compressive vectors are displayed.
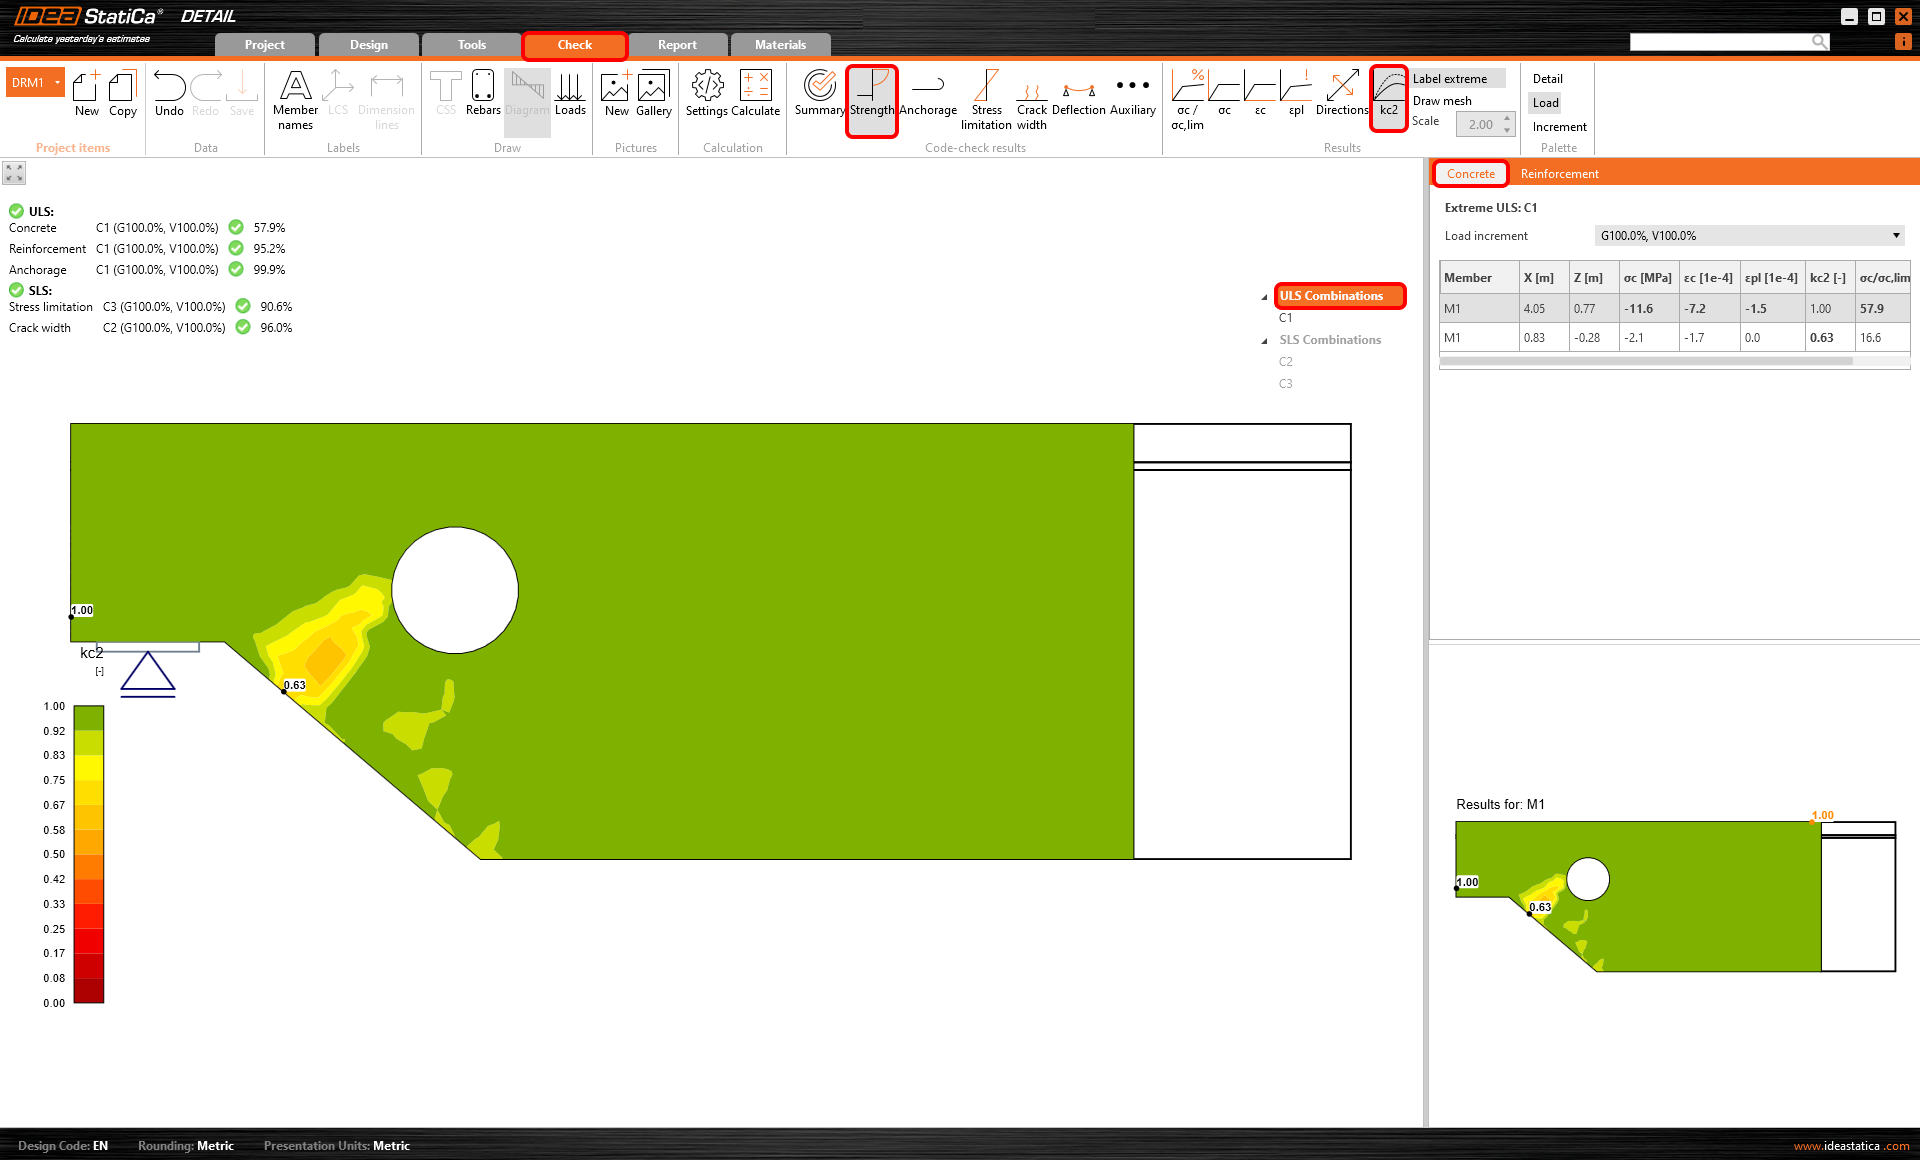
Compressive strength reduction factor
The sixth option shows the distribution of the concrete compressive strength reduction due to transversal strain. This is the compression softening effect. This phenomenon (kc2), together with the increasing brittleness of concrete with strength, is taken into account through the factor kc.
To learn more, read the article: Material models (EN).
Reinforcement
For steel, similar to concrete, we have more options for displaying the results. In general, it is possible to display stress and strain in reinforcement and the ratio of stress or strain and limit values.
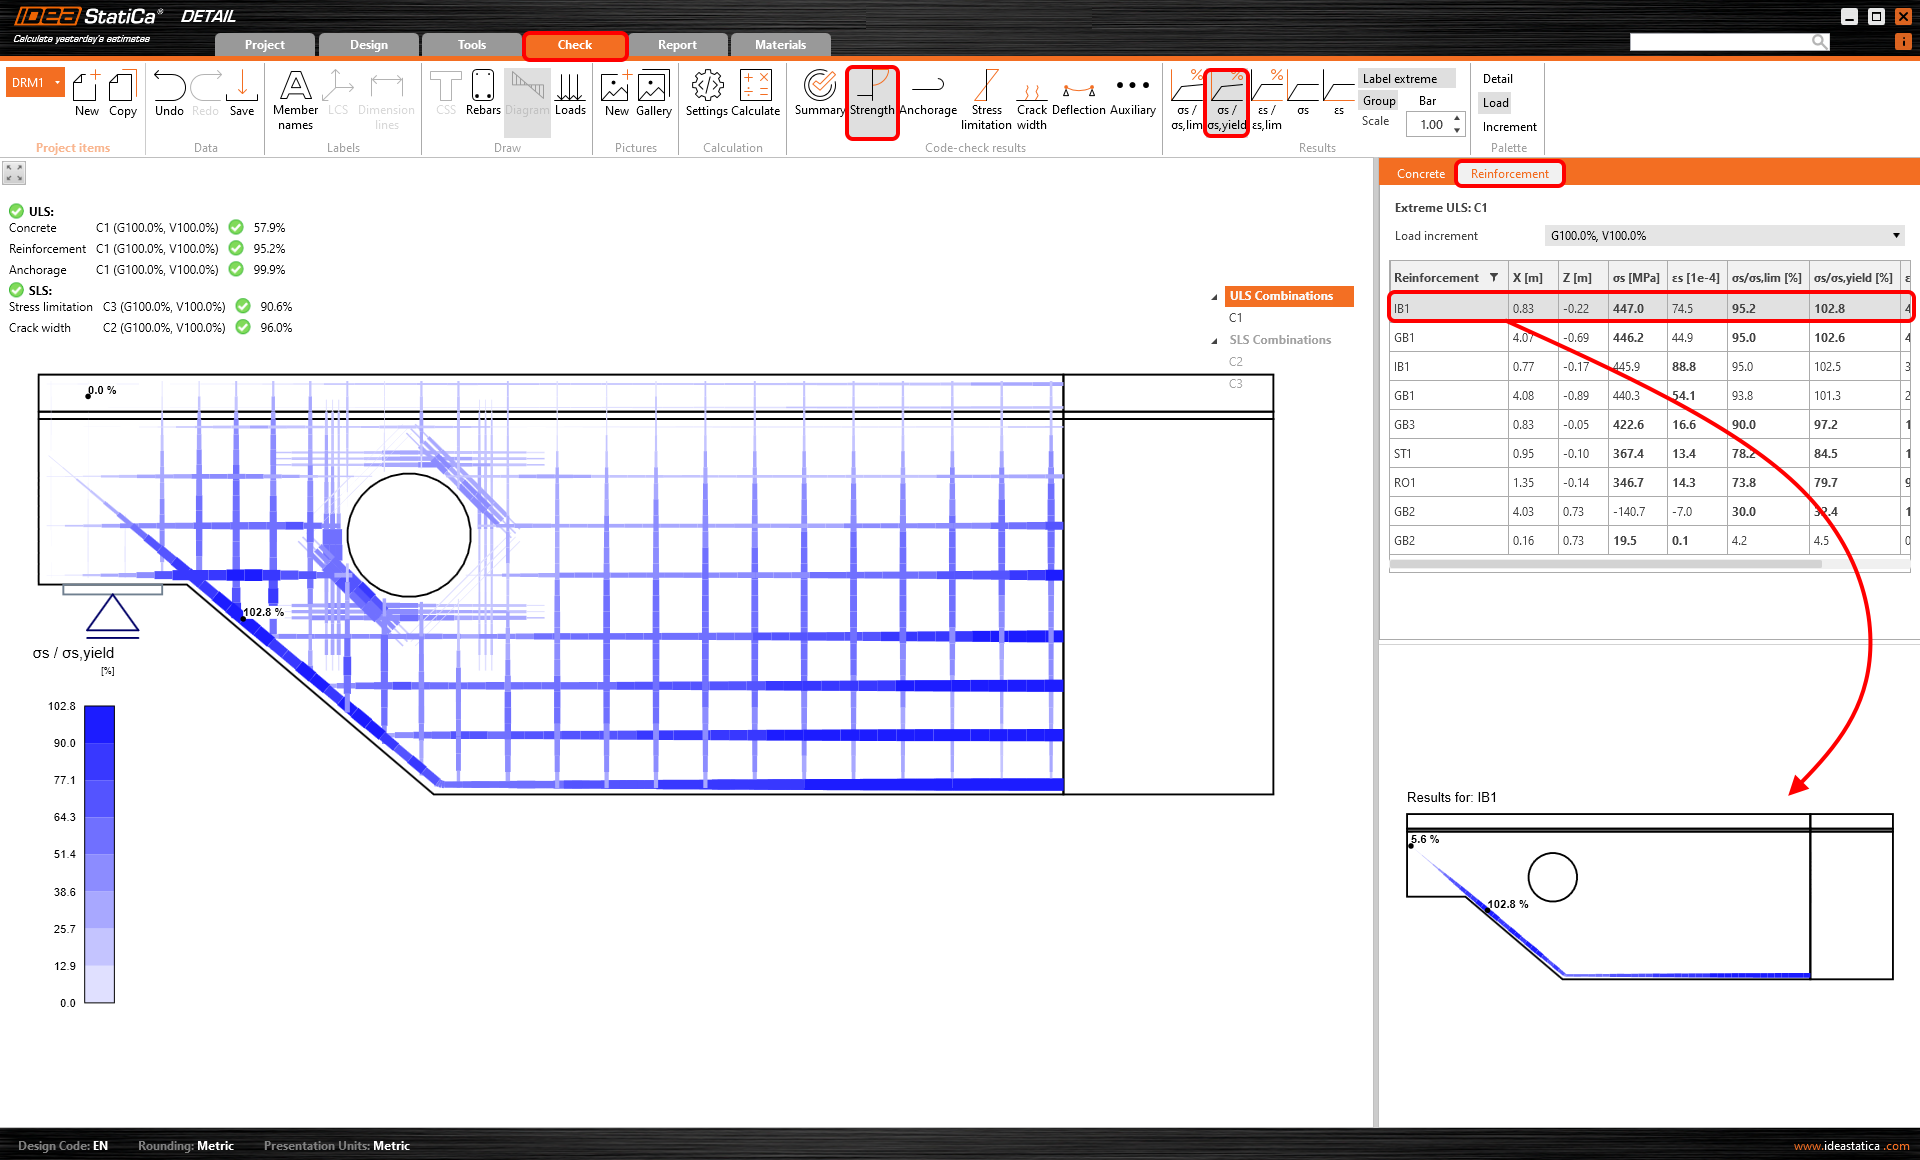
Ratio of stress or strain and limit values
First two icons allow you to check the ratio of stress and strain to their limit values. The third icon shows a comparison of stress and yield stress. In other words, you can see the level of material utilization.
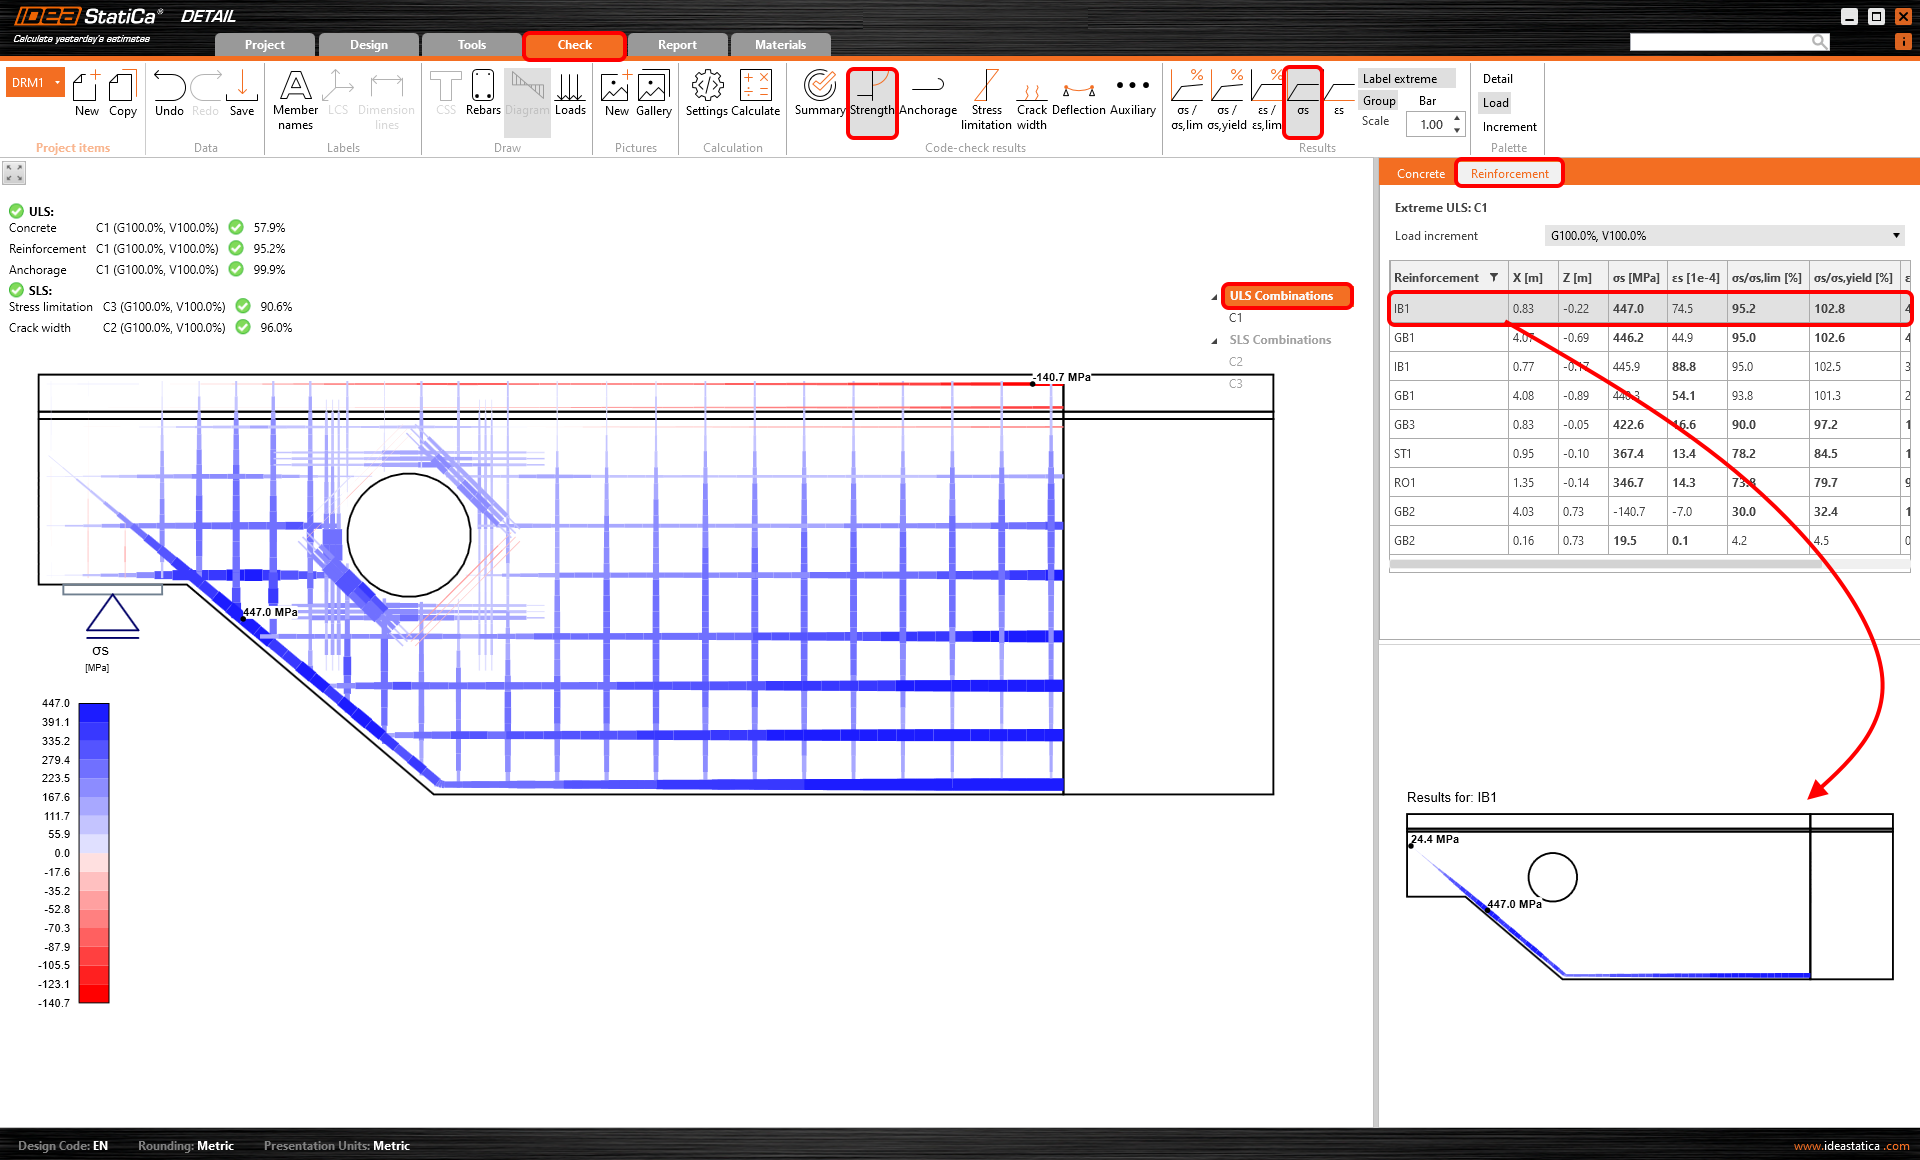
Stress and strain
In addition to those mentioned above, there is an option to display the strain (εs) or the stress (σ2) of the reinforcement. In the data tab, you can observe the individual bars one by one. Or you can check the model and the overview in the Main window.
Anchorage
Anchorage is the last available result for ULS.
To understand where the forces entering the calculation come from, let's discuss the individual components first.
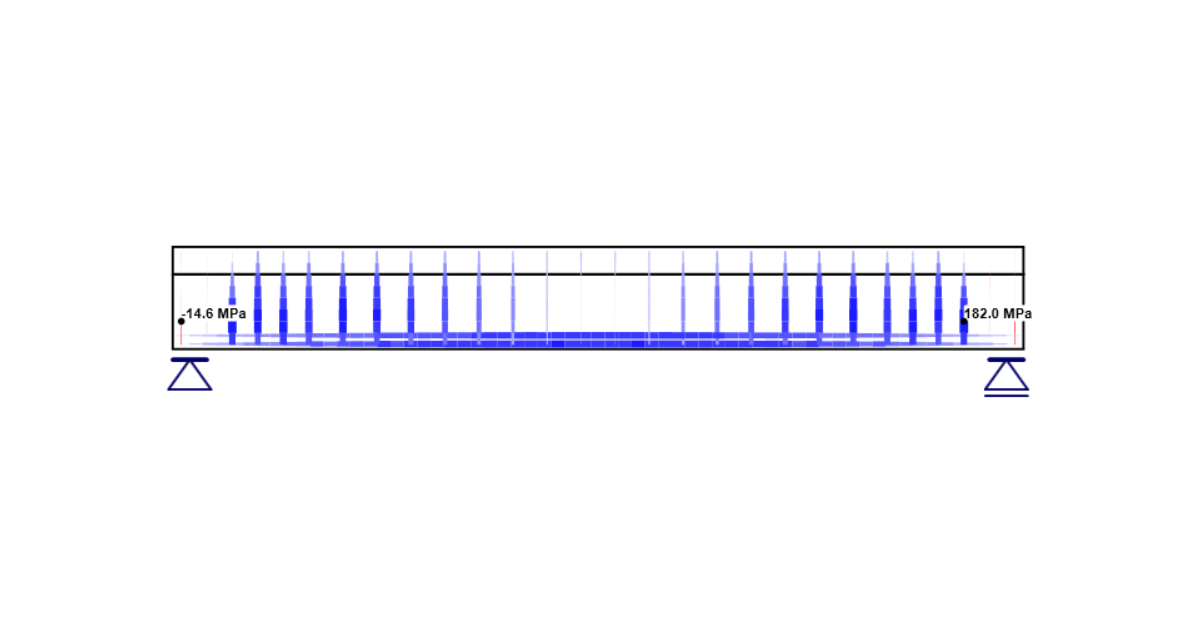
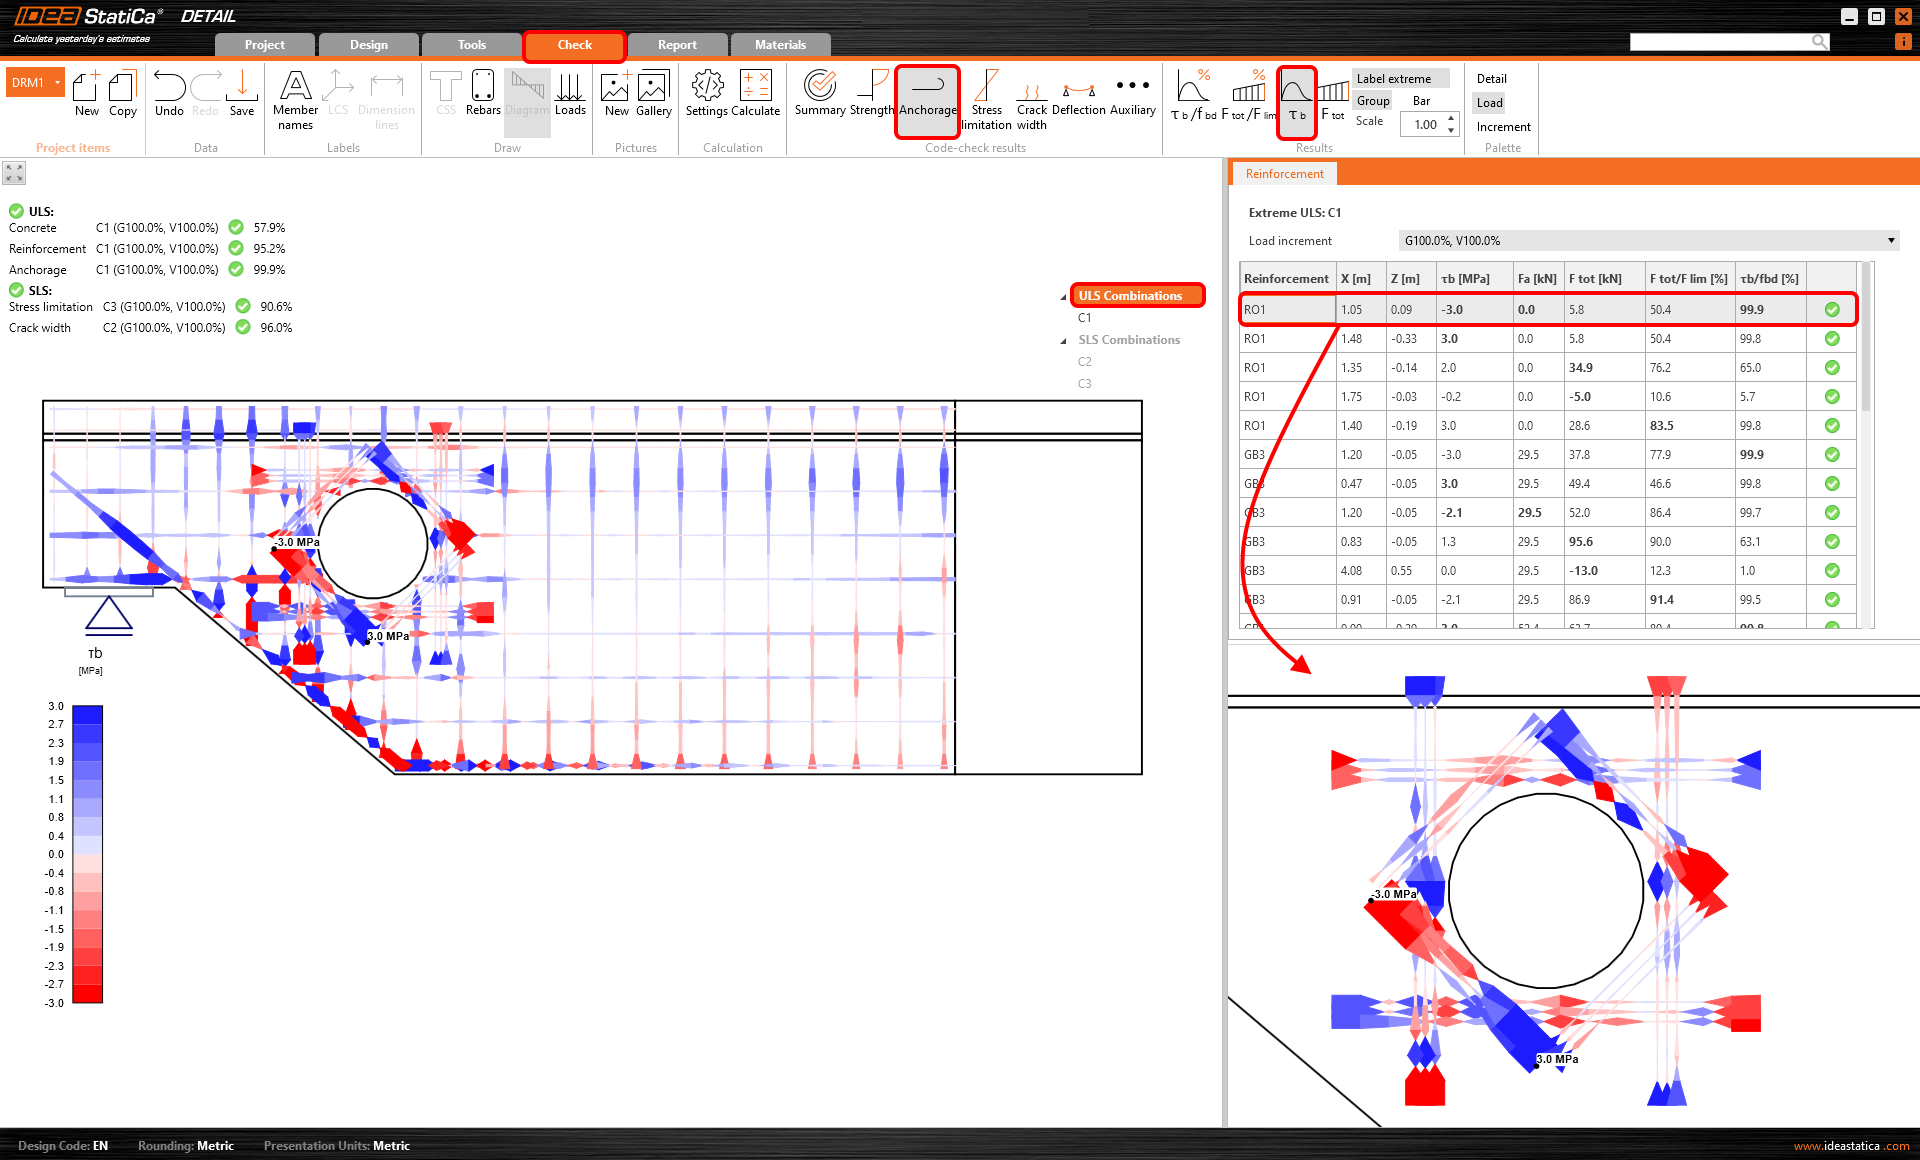
Bond stress
The bond stress 𝜏b (stress on the surface of the reinforcement bar) is calculated from the deformation of the bond element that represents the connection between concrete (2D element) and reinforcement (1D element). This relation is expressed by the stress-deformation function, see the figure below.
Note that the slip is allowed.
fbd* - yield bond stress
fbd - limit bond stress
Gb - shear stiffness in elastic part
Rf - Coefficient for hardening
δu, max - Ultimate slip
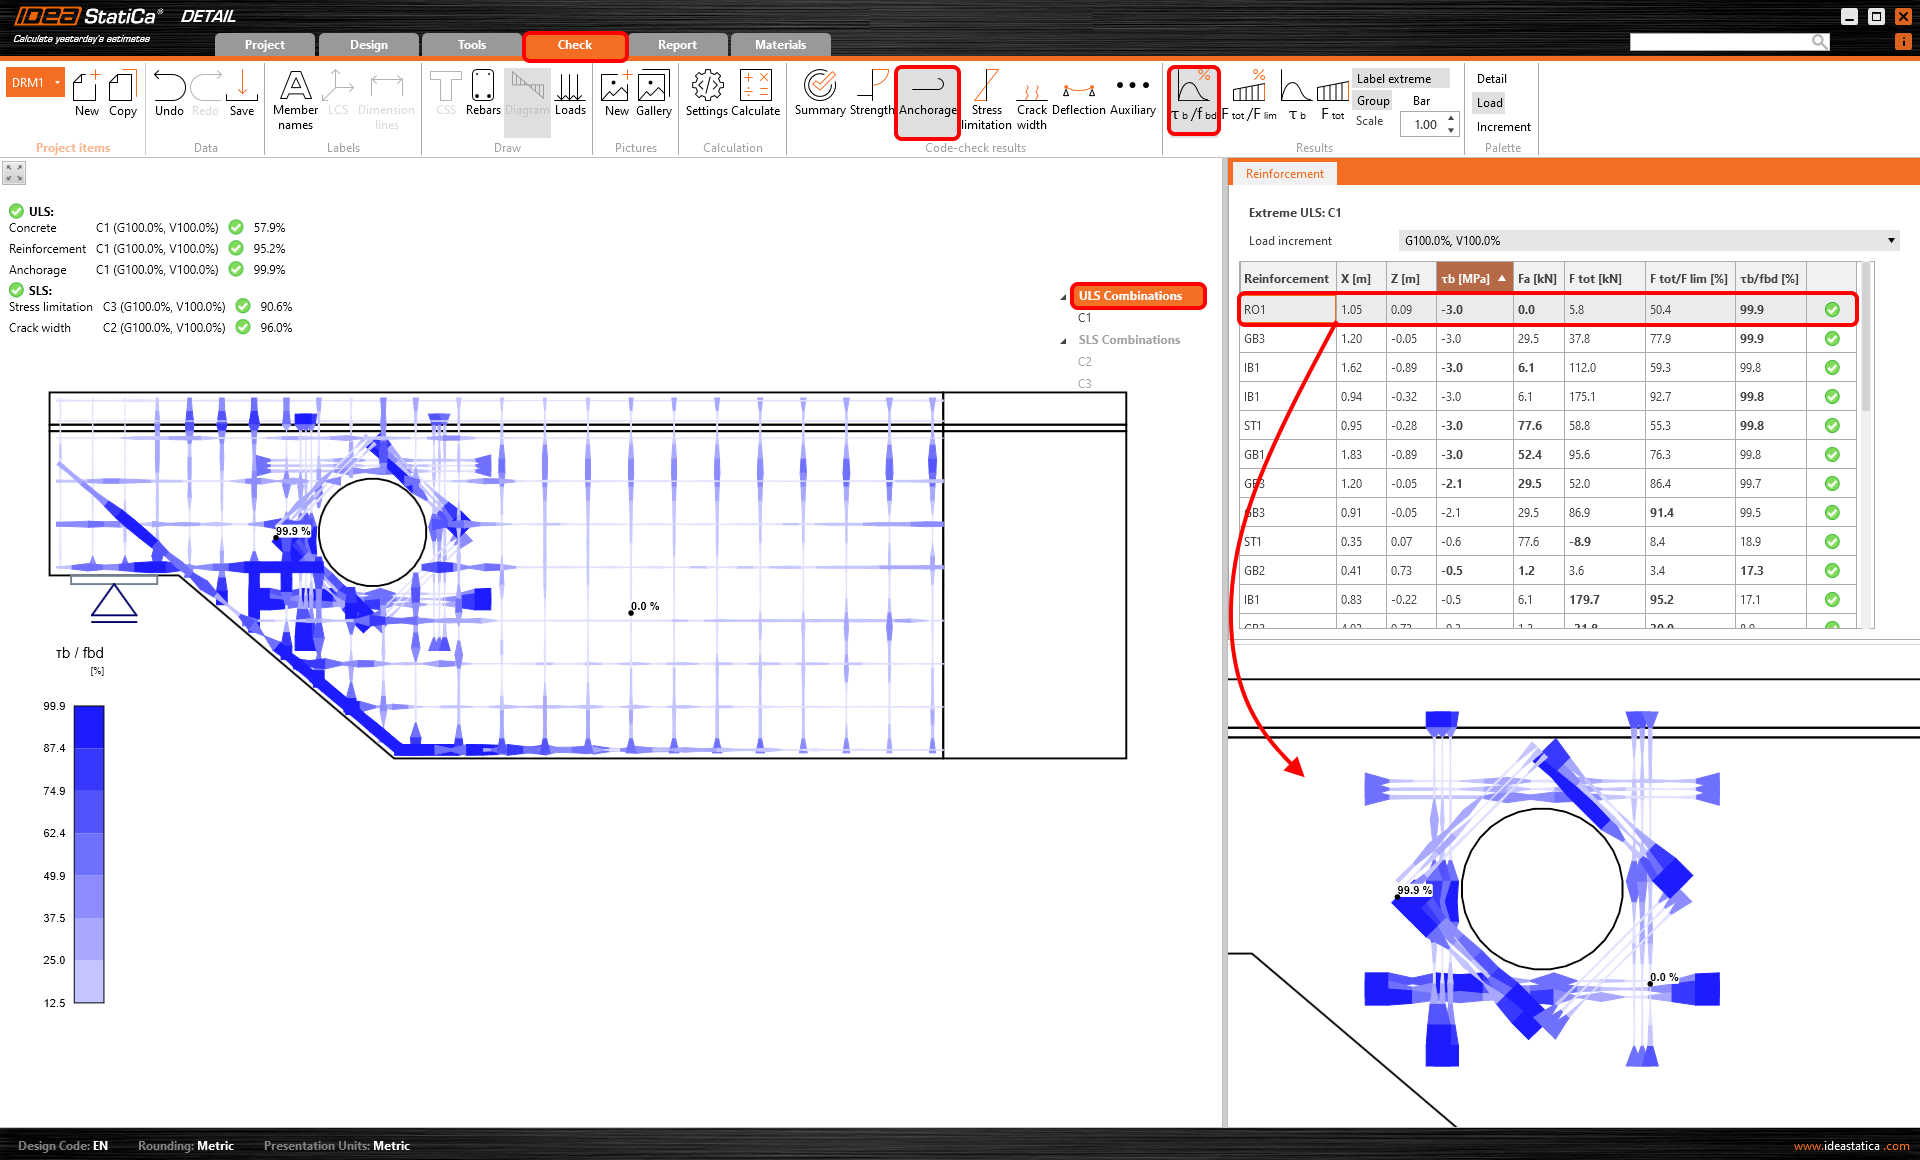
Once the plastic branch is reached - 𝜏b = fbd*, the stress (𝜏b) no longer increases so much compared to deformation (δu). At that point (𝜏b = fbd*), you get a bond stress ratio check (𝜏b/fbd) above 99 %. The check is passing until the limit deformation δu, max is reached.
Anchorage force
The force transmitted by the spring that represents the selected anchorage type of reinforcement is called anchorage force. The maximum* anchorage force is calculated according to the following formula - Fau=β⋅As⋅fyd, where:
β the anchorage coefficient based on anchorage type,
As the cross-section of the reinforcing bar,
fyd the design value of the yield strength of the reinforcement.
*The maximum force can be achieved in the reinforcement at full utilization. In fact, the force transmitted by the spring Fa will be calculated from the real stress in the reinforcement and will be further reduced by force trapped along the length of the reinforcement, depending on the bond model (cohesion) between concrete and reinforcement.
To learn about more theory behind anchorage and to understand the bond model read the further article:
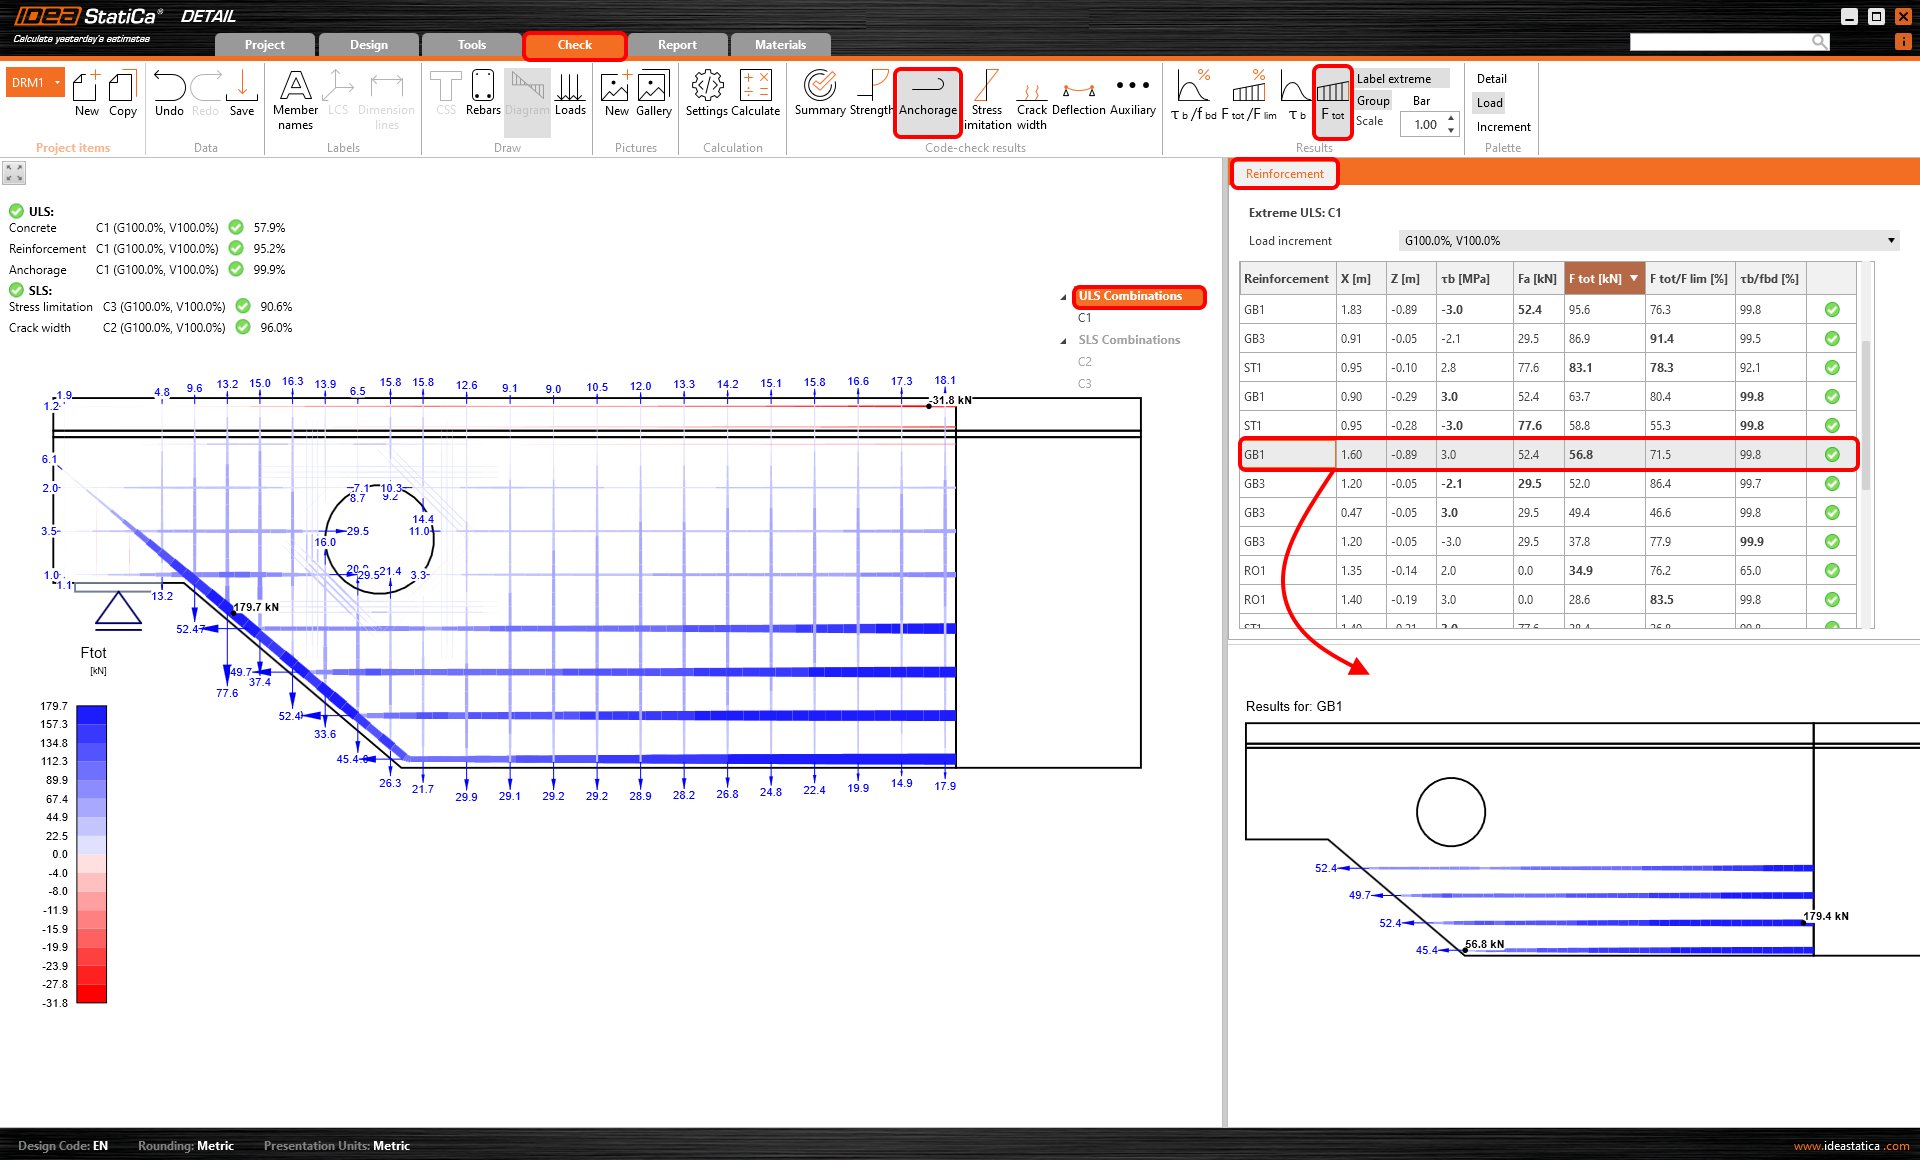
Total force
The total force Ftot is a result of the finite element analysis and can be defined in two ways.
\[F_{tot}=A_{s}\cdot \sigma_{s}\]
where As is the area of the reinforcement bar and σs is the stress in the bar.
Bond stress check value
The ratio of bond stress (𝜏b) and ultimate bond strength for selected (group of) bars is displayed. It shows the level of utilization with respect to ultimate bond strength between the rebar and adjacent concrete.
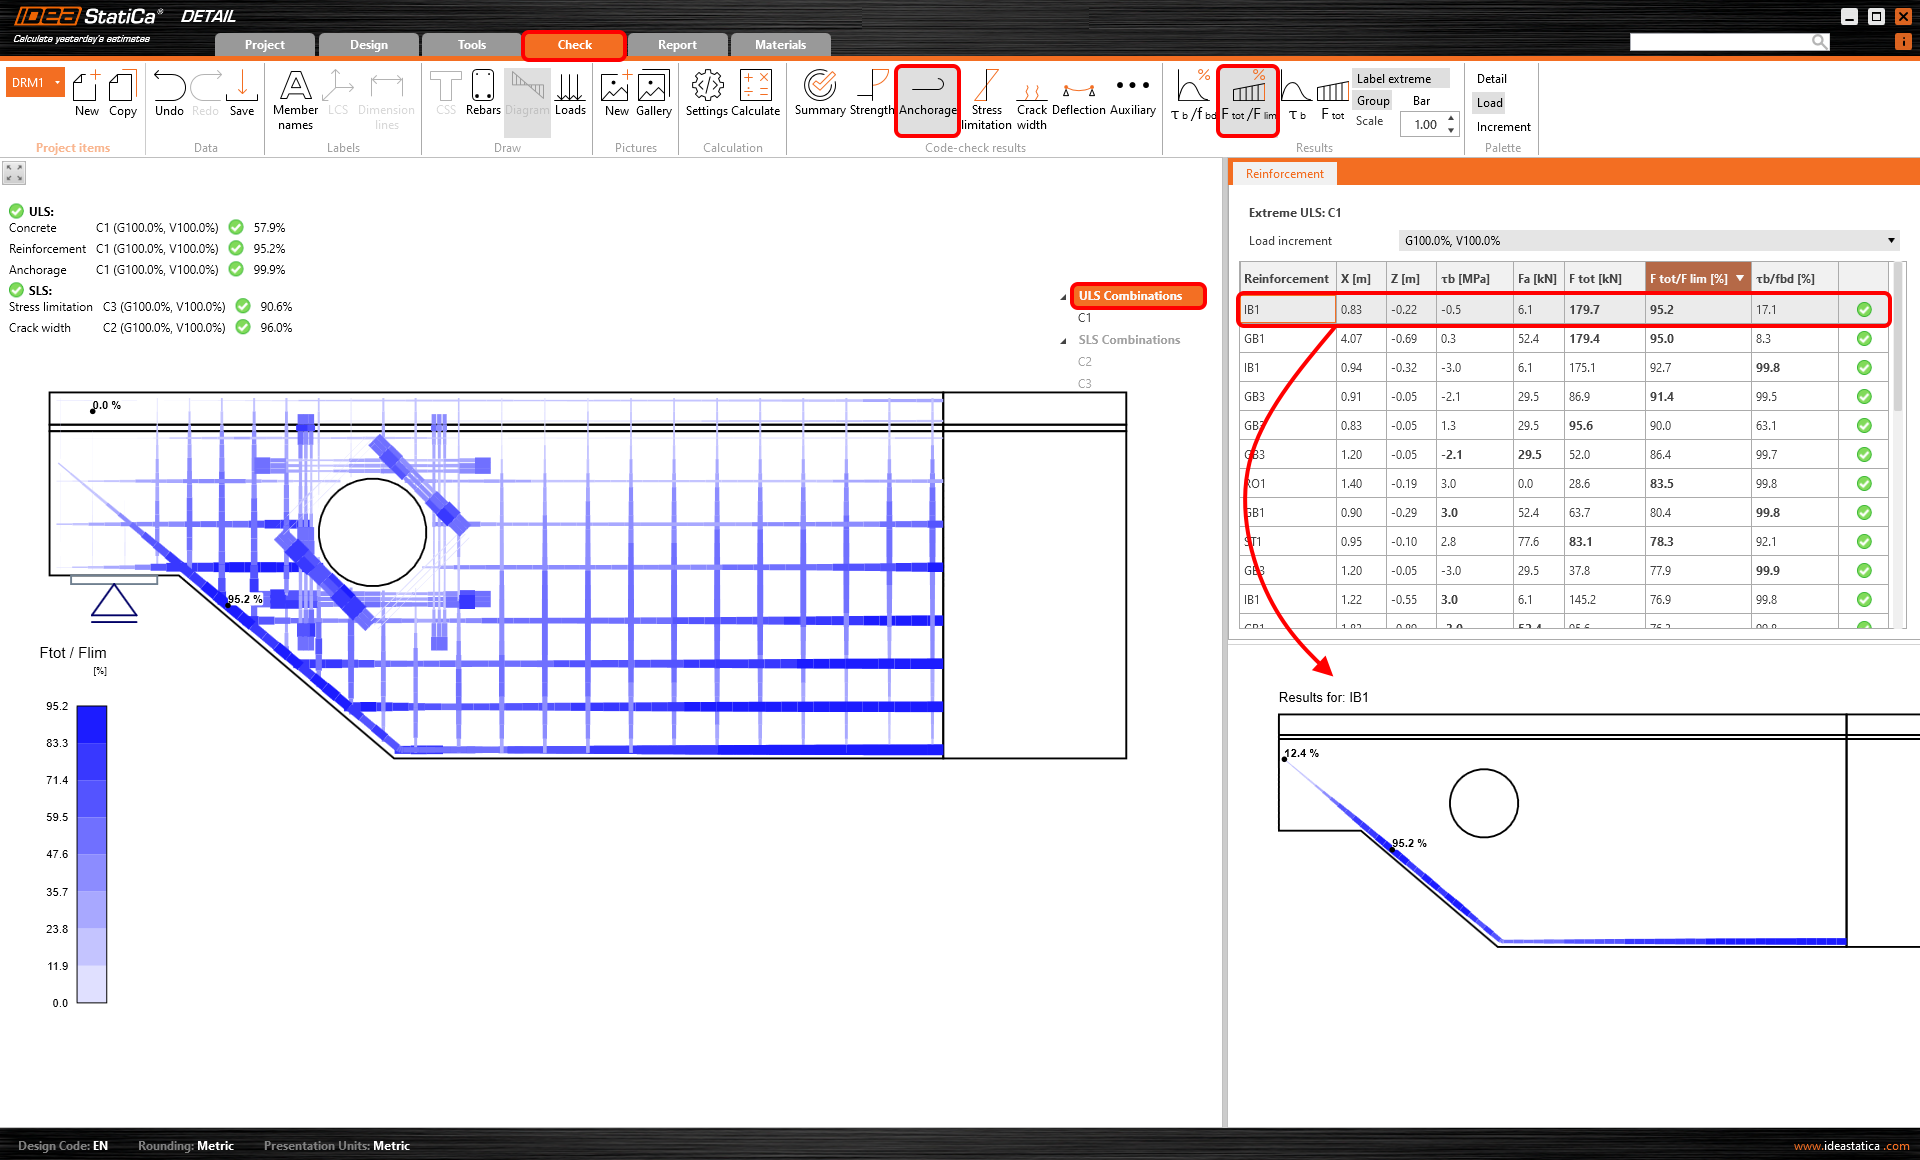
Force check value
Force check value is the ratio of the total force (Ftot) in the bar and the limit value. The limit value of the force calculates as the minimum of two values:
- The force is calculated as the sum of the ultimate anchorage force and the force developed from the end of the bar to the point of interest, assuming the ultimate bond strength
- The ultimate strength of the bar
In other words, Flim is the ultimate force in reinforcement, considering the ultimate anchorage force and ultimate resistance of the rebar.
Learn more about Ftot and Flim in the following article:


