Double-tee Moment Prequalified Connection - AISC
This verification example was prepared in a joint project between Ohio State University and IDEA StatiCa. The authors are listed below:
- Baris Kasapoglu, Ph.D. student
- Ali Nassiri, Ph.D.
- Halil Sezen, Ph.D.
5.1. Introduction
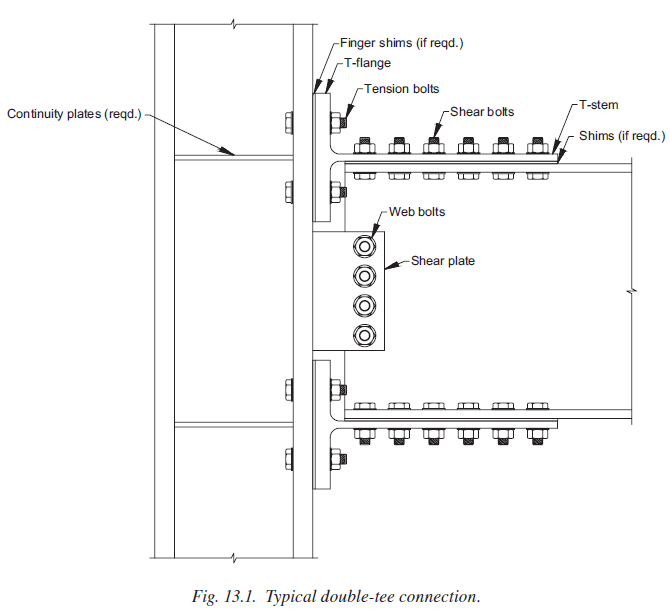
The last steel connection type studied in this research is double-tee moment connection (see Figure 5.1). Double-tee is a prequalified connection to be used in the seismic region as part of IMF and SMF system if the requirements outlined in AISC 358 are satisfied. For the scope of this study, an experimental study conducted for a double-tee connection and its variations was chosen from the literature and their flexural capacities were examined following AISC design procedure as well as using IDEA StatiCa. Also, the baseline model was analyzed using ABAQUS software, and the results were compared.
Figure 5.1: Typical double-tee moment connection (AISC 358)
In the following sections, the experimental test is described, AISC design checks conducted for those specimens are summarized, and the numerical analysis results obtained from IDEA StatiCa and ABAQUS are discussed. At the end, the results obtained from three sources (i.e., tests, AISC design procedures, and numerical analyses) are compared.
5.2 Experimental Study
Six full-scale double-tee connections and 48 individual T-stubs were tested at Georgia Institute of Technology by Leon (1999) as part of the SAC Task 7.03 project. The primary purpose of this study was to have a better understanding of the behavior of bolted connections under cyclic loads and verify whether the results of small-scale component tests can be extrapolated to full-scale connections. In the scope of this study, only the details and results of six full-scale tests are summarized. For further details of the experiments, readers are referred to Swanson (1999) and Smallidge (1999) in addition to the test report by Leon (1999).
All specimens consist of a W14×145 column whereas beam varies from W21×44 to W24×55. All fasteners were high strength A490 tension-controlled bolts with a diameter of either 7/8 in. or 1 in. T-stubs were cut from three different wide flange steel sizes (W16×45, W16×100 and W21×93). A 3/8-in. thick shear tab was used for all the specimens with a length of either 9 in. or 12 in. depending on the number of bolts. Among the six specimens, one of them was chosen as a baseline model (Test ID: FS-06), and the rest were studied as variation models (see Table 5.1).
Table 5.1: Properties of the double-tee specimens (Leon, 1999)
| Specimen no (Test ID) | Beam | Column | T-stub | Bolts |
| Baseline (FS-06) | W24×55 | W14×145 | W16×100 | 1 in. A490 |
| Variation 1 (FS-03) | W21×44 | W14×145 | W16×45 | 7/8 in. A490 |
| Variation 2 (FS-04) | W21×44 | W14×145 | W16×45 | 1 in. A490 |
| Variation 3 (FS-05) | W24×55 | W14×145 | W16×100 | 7/8 in. A490 |
| Variation 4 (FS-07) | W24×55 | W14×145 | W21×93 | 7/8 in. A490 |
| Variation 5 (FS-08) | W24×55 | W14×145 | W21×93 | 1 in. A490 |
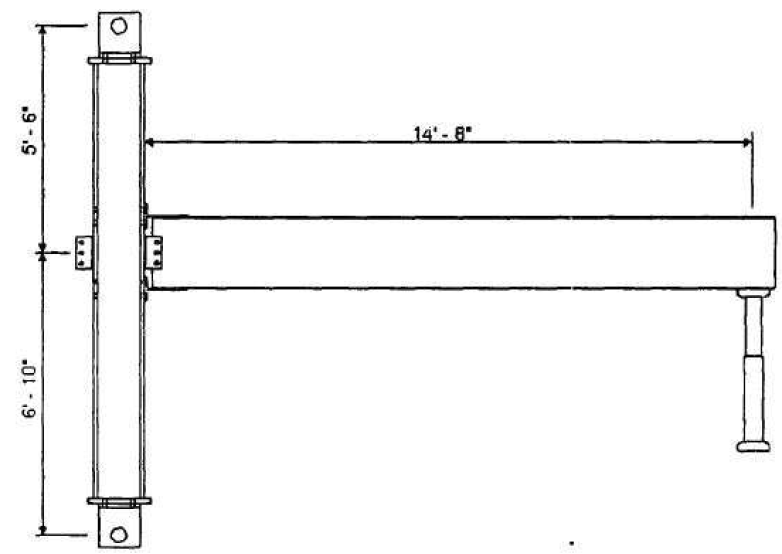
The test setup consists of a 152 in. long column (from pinned top to pinned bottom locations) and a beam connected to column flange at 82 in. above from the bottom support of column. The length of the beam from column face to actuator was 176 in., and a lateral bracing was provided at 5 ft from the connection. The test setup is shown in Figure 5.2.
Figure 5.2: Test setup (Leon, 1999)
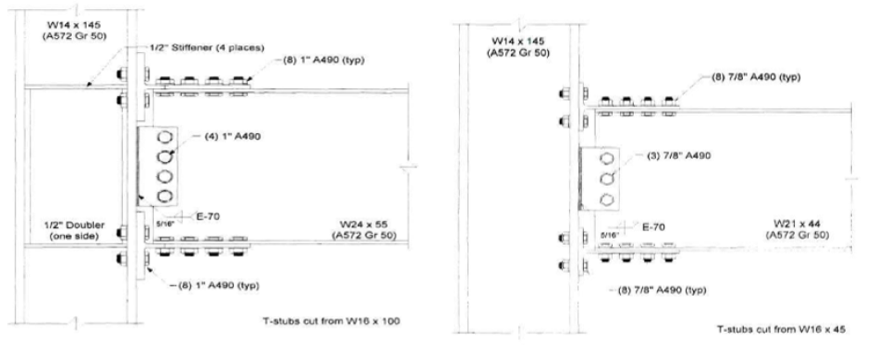
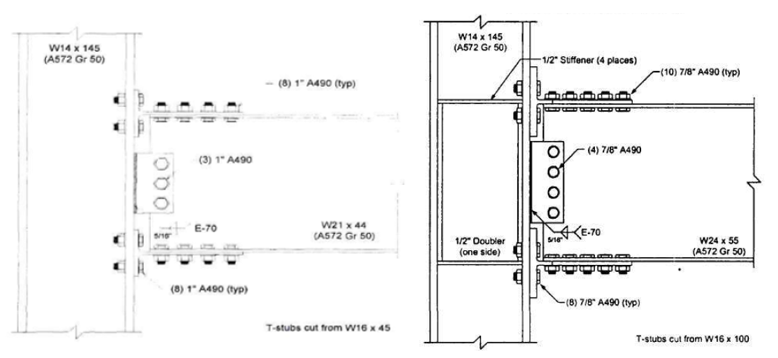
The baseline model consists of a W14×145 column, a W24×55 beam, and two T-stubs cut from W16×100. Eight 1 in. diameter A490 shear and eight 1 in. diameter A490 tension bolts are used in the T-stub flanges. Four 1 in. diameter A490 bolts are used to fasten the shear tab to the beam web while the shear tab is welded to the column flange with 5/16 in. double fillet weld. Also, four ½ in. thick continuity plate and ½ in. thick one-sided doubler plate are used as depicted in Figure 5.3.
Variation 1 consists of a W14×145 column, a W21×44 beam, two T-stubs cut from a W16×45 which are used to fasten the beam flanges and the column flanges with eight 7/8 in. diameter A490 shear and eight 7/8 in. diameter A490 tension bolts. Three 7/8 in. diameter A490 bolts are used between the shear tab and the beam web, and 5/16 in. double fillet weld is used between the column face and shear tab as shown in Figure 5.3.
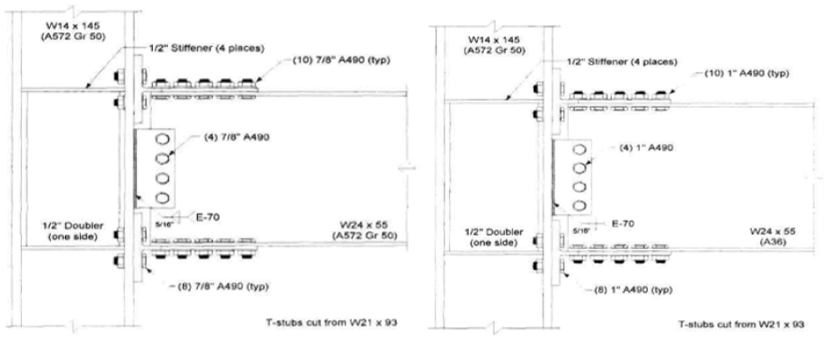
Variation 2 consists of 1 in. diameter A490 bolts differently from variation 1. All other details are identical to variation 1. The configuration of the variation 2 is illustrated in Figure 5.4. Variation 3 consists of a W14×145 column, a W24×55 beam and T-stubs cut from a W16×100. Ten 7/8 in. diameter A490 shear bolts and eight 7/8 in. diameter A490 tension bolts are used in both T-stubs. Four 7/8 in. diameter A490 bolts are used to fasten the shear tab and beam web while 5/16 in. double fillet weld is used between the column flange and the shear tab. Four ½ in. thick continuity plate and ½ in. thick one-sided doubler plate is used to reinforced the column panel zone. The differences between the baseline model and variation 3 are the diameter of the bolts and the number of shear bolts used to fasten the T-stub flanges and the beam flanges (see Figure 5.4).
Figure 5.3: Left) Configuration of baseline model; Right) configuration of variation 1 (Leon, 1999)
Figure 5.4: Left) Configuration of variation 2; Right) configuration of variation 3 (Leon, 1999)
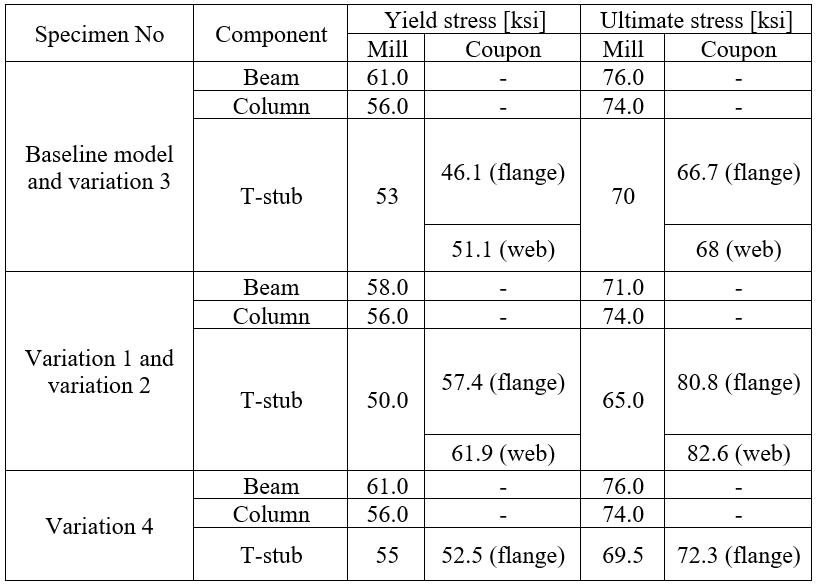
Variation 4 consists of a W24×55 beam, T-stubs cut from a W21×93, and four bolted shear tab. Ten shear bolts are used to fasten T-stub flanges to the beam flanges and eight tension bolts on at each T-stub to be attached to the column face. The column panel zone is reinforced with four ½ in. thick continuity plate and ½ in. thick one-sided doubler plate. A490 bolts with 7/8 in. diameter are used for all fasteners. Variation 5, differently from variation 4, has a larger bolts with 1 in. diameter. Rather than this, all other geometrical properties are identical as illustrated in Figure 5.5. The average coupon test and mill certificate material properties for beam, column and T-stubs are presented in Table 5.2.
Figure 5.5: Left) Configuration of variation 4; Right) configuration of variation 5 (Leon, 1999)
Table 5.2: Measured material properties of the tested double-tee specimens (Leon, 1999)
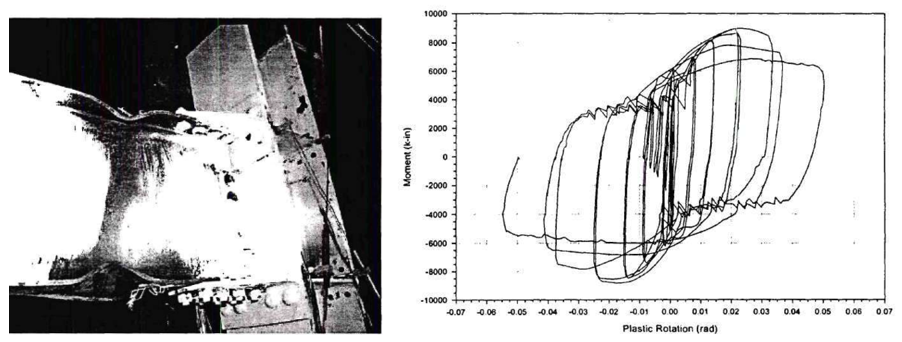
From the test of baseline model, the local buckling of the beam was identified as the failure mode. The experiment was discontinued after extensive local buckling was observed on the beam web and flanges when the peak moment reached approximately 9,003 kips-in. at the connection. At this point, the corresponding force in T-stub was 381.1 kips. After test photo and measured moment plastic rotation are presented in Figure 5.6.
Figure 5.6: Left) Baseline model after testing; Right) moment-total plastic rotation relationship (Leon, 1999)
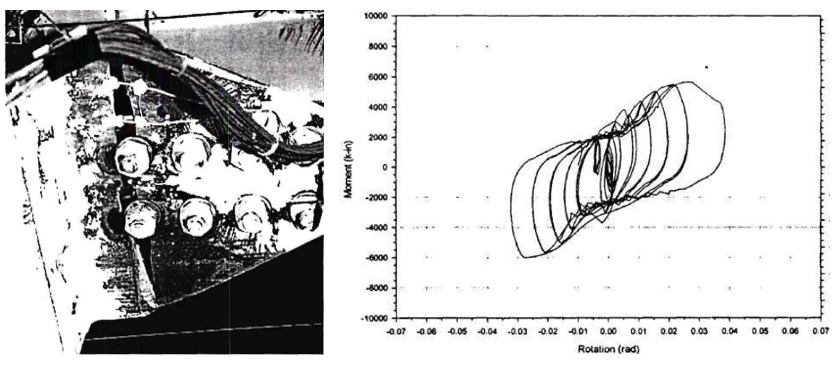
In variation 1, the maximum actuator load and the maximum moment at the connection were reported as 32.8 kips and 6,011 kips-in., respectively. Initial yielding of T-stub was observed when the force in T-stub and the moment at the connection were approximately 185 kips and 3,800 kips-in., respectively. The first yielding of beam was reported when the moment at the connection was around 5,000 kips-in. During further cycles, the specimen failed due to the T-stub fracture along the first row of shear bolts. After the test photo and measured moment plastic rotation are presented in Figure 5.7.
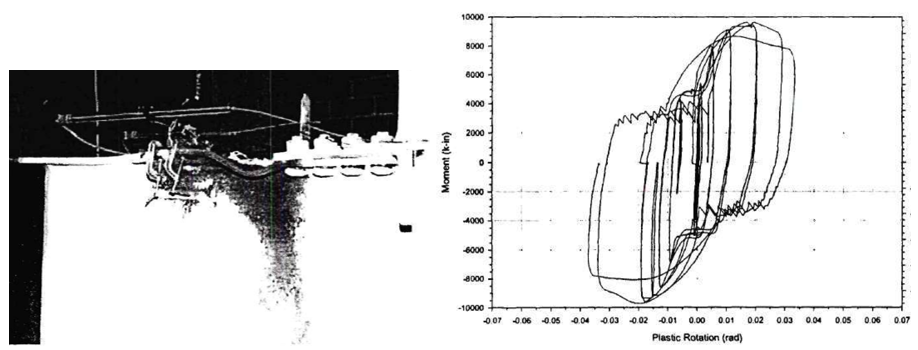
In variation 2, the first yielding in T-stub and beam flange was noticed when the force in the T-stub and moment at the connection were approximately 245 kips and 5,000 kips-in., respectively. Flange buckling was observed during the further loads, and the specimen failed due to the net section fracture. The reported maximum moment at the connection was approximately 6,183 kips-in. After the test photo and measured moment plastic rotation are presented in Figure 5.8.
Figure 5.7: Left) Variation 1 after testing; Right) moment-total plastic rotation relationship (Lee et al., 1999)
Figure 5.8: Left) Variation 2 after testing; Right) moment-total plastic rotation relationship (Leon, 1999)
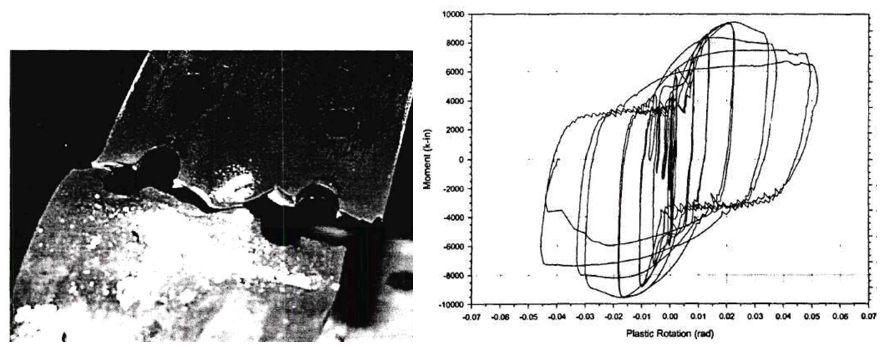
Regarding the test of variation 3, the failure mode was reported as beam local buckling. After that the extensive local buckling was observed on the beam flanges, the test was stopped. The maximum moment at the connection was approximately 9,739 kips-in. After the test photo and measured moment plastic rotation are presented in Figure 5.9.
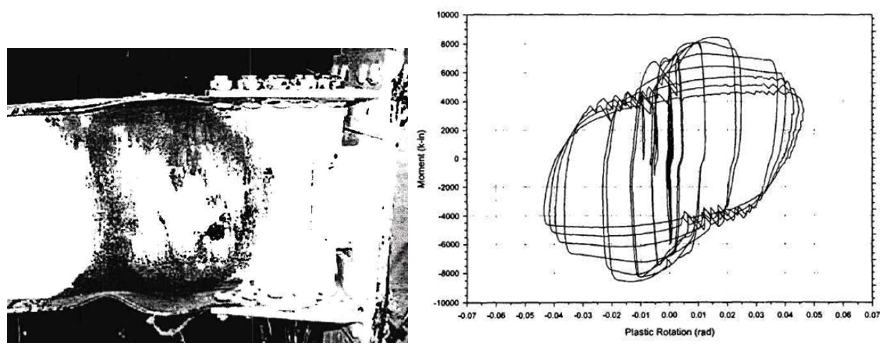
It was observed from the test of variation 4 that the specimen underwent local buckling in the flange. When the tip displacement was approximately 12.8 in., fracture occurred on the beam flange along the bolt line farthest to the column flange. The peak moment at the connection was approximately 9,580 kips-in. with a corresponding T-stub force of 405.5 kips. After the test photo and measured moment plastic rotation are presented in Figure 5.10.
Figure 5.9: Left) Variation 3 after testing; Right) moment-total plastic rotation relationship (Leon, 1999)
Figure 5.10: Left) Variation 4 after testing; Right) moment-total plastic rotation relationship (Leon, 1999)
The observations from the test of variation 5 were similar to those of the baseline model and variation 3. The specimen experienced extensive beam local buckling during the test. The test was discontinued when the maximum moment at the connection was approximately 8,586 kips-in. At this point, the corresponding force in T-stub was 363,4 kips. After the test photo and measured moment plastic rotation are presented in Figure 5.11.
Figure 5.11: Left) Variation 5 after testing; Right) moment-total plastic rotation relationship (Leon, 1999)
5.3 Code Design Calculations
Prequalification limits and design procedure for double-tee moment connections are outlined in Chapter 13 of AISC 358 (2016). The following design checks were identified and performed for the tested specimens:
- T-stem strength (AISC 358, Eq. 13.6-45)
- Shear bolt diameter (AISC 358, Eq. 13.6-4)
- Tension bolt diameter (AISC 358, Eq. 13.6-16)
- Tension bolt diameter (AISC 358, Eq. 13.6-16)
- Rotational stiffness of connection (AISC 358, Eq. 13.6-28)
- T-stub strength (AISC 358, Eq. 13.6-46)
- Bearing/tearout strength of beam flange (AISC 360, Eq. J3-6)
- Bearing/tearout strength of T-stem (AISC 360, Eq. J3-6)
- Block shear strength of beam flange (AISC 360-16, Eq. J4-5)
- Block shear strength of T-stem (AISC 360-16, Eq. J4-5)
- Flexural yielding strength of column (AISC 358, Eq. 13.6-61)
- Continuity plate requirements (AISC 341, Sec. E3.6f.1(a))
- Column-beam relationships (AISC 341, Eq. E3-1)
- Panel zone strength (AISC 360, Eq. J10-11)
- Beam flexural strength (AISC 360, Eq. F1-1)
- Check bolt strength of shear plate (AISC 360, Eq. J3-6a)
- Check weld strength of shear tab (AISC 360, Eq. J4-2)
- Check shear yielding, rupture, block shear strength of shear plate (AISC 360, Eq. J3-J4)
It was assumed that shear tab, doubler plate and continuity plate had identical measured material properties with T-stub. The nominal tensile strength (fnt = 90 ksi) and shear strength (fnv = 68 ksi) values provided in AISC Table J3 were used for A490 bolts. Five models were developed using mill certificate material test reports for each specimen. Two additional models were developed for variation 1 and variation 2 using coupon material test properties measured for T-stub. Design checks were performed for the selected specimens, and the summary is presented in Table 5.3.
Table 5.3: Design checks for double-tee moment connections
| AISC Design Checks | Baseline | Var-1 | Var-1 | Var-2 | Var-2 | Var-3 | Var-4 | Var-5 |
| Mill | Mill | Coupon | Mill | Coupon | Mill | Mill | Mill | |
| T-stem strength | Not OK | Not OK | Not OK | Not OK | Not OK | OK | OK | OK |
| Shear bolt diameter | OK | Not OK | OK | Not OK | OK | OK | OK | OK |
| Tension bolt diameter | OK | OK | OK | OK | OK | OK | OK | OK |
| Minimum T-flange thickness | OK | OK | OK | OK | OK | OK | OK | OK |
| Rotational stiffness of connection | OK | OK | OK | OK | OK | OK | OK | OK |
| T-stub strength | OK | OK | OK | OK | OK | OK | OK | OK |
| Bearing/tearout strength of beam flange | OK | Not OK | Not OK | OK | OK | OK | OK | OK |
| Bearing/tearout strength of T-stem | OK | Not OK | Not OK | Not OK | Not OK | OK | OK | OK |
| Block shear strength of beam flange | Not OK | Not OK | Not OK | Not OK | Not OK | Not OK | OK | OK |
| Block shear strength of T-stem | Not OK | Not OK | Not OK | Not OK | Not OK | OK | OK | OK |
| Flexural yielding strength of column | OK | OK | OK | OK | OK | OK | OK | OK |
| Continuity plate requirements | Not OK | Not OK | Not OK | Not OK | Not OK | Not OK | Not OK | Not OK |
| Column-beam relationships | OK | OK | OK | OK | OK | OK | OK | OK |
| Panel zone strength | OK | OK | OK | OK | OK | OK | OK | OK |
| Beam flexural strength | OK | OK | OK | OK | OK | OK | OK | OK |
| Bolt strength of shear plate | OK | OK | OK | OK | OK | OK | OK | OK |
| Weld strength of shear tab | OK | OK | OK | OK | OK | OK | OK | OK |
| Shear yielding, shear rupture, block shear strength of shear plate | Not OK | OK | OK | OK | OK | Not OK | Not OK | Not OK |
Failure mode of a double-tee moment connection can be estimated if the governing limit state of the followings are known:
- Strength of stem gross section yielding
- Strength of stem net section fracture
- Strength of stem flexural buckling
- Strength of shear bolt
- Strength of bearing/tearout of beam
- Strength of bearing/tearout of T-stem
- Strength of block shear of beam
- Strength of block shear of T-stem
- Beam plastic moment strength
For each limit state, moment strengths at column face of the specimens were calculated (see Appendices I and J), and the results are presented in Table 5.4. The controlling moment strength (i.e., the lowest strength) are identified and shown with bolded font.
Table 5.4: Moment strength of the specimens
| Moment Strength | Baseline [kips-in.] | Var-1 [kips-in.] | Var-1 [kips-in.] | Var-2 [kips-in.] | Var-2 [kips-in.] | Var-3 [kips-in.] | Var-4 [kips-in.] | Var-5 [kips-in.] |
| Mill | Mill | Coupon | Mill | Coupon | Mill | Mill | Mill | |
| Stem gross section yielding | 10,412 | 4,570 | 5,246 | 5,041 | 5,787 | 11,623 | 11,956 | 11,956 |
| Stem net section fracture | 11,400 | 4,996 | 6,211 | 5,432 | 6,753 | 13,369 | 13,157 | 12,793 |
| Stem flexural buckling | 10,412 | 4,570 | 5,246 | 5,041 | 5,787 | 11,623 | 11,956 | 11,956 |
| Shear bolt | 12,758 | 7,928 | 9,856 | 9,061 | 11,264 | 12,189 | 12,187 | 15,944 |
| Bearing/tearout of beam | 14,619 | 9,524 | 9,524 | 10,590 | 10,590 | 16,906 | 16,903 | 17,482 |
| Bearing/tearout of T-stem | 16,681 | 7,222 | 8,667 | 7,956 | 9,608 | 19,299 | 19,012 | 20,945 |
| Block shear of beam | 9,213 | 6,266 | 6,266 | 6,673 | 6,673 | 10,460 | 10,922 | 10,878 |
| Block shear of T-stem | 9,829 | 4,398 | 5,467 | 4,684 | 5,823 | 11,160 | 11,471 | 12,281 |
| Beam plastic moment | 8,749 | 8,071 | 8,108 | 8,108 | 8,162 | 8,802 | 8,802 | 7,880 |
Based on the AISC design calculations, beam plastic moment was the estimated failure mode for the baseline model, variation 3, variation 4, and variation 5. Regarding variation 1 and variation 2, block shear of T-stem was the governing limit state when coupon test properties are used for T-stubs. When the mill certificate material properties are used for all members, their failure modes were switched to the stem gross section yielding.
5.4 IDEA StatiCa Analysis
IDEA StatiCa models were developed for the specimens to evaluate their moment strength capacities. Since the purpose was to simulate the experimental tests, SAP2000 model was developed for the test setup condition, and the forces at the column centerline were calculated. The measured material properties were used, and the resistance factors were set to 1.0. Using the stress-strain analysis type in IDEA StatiCa (i.e., EPS), the moment capacities were calculated, and the failure modes of the specimens were estimated. For the baseline model, the moment-rotation relationship was calculated using the connection stiffness analysis type (i.e., ST) in IDEA StatiCa software. Moreover, capacity design analysis (i.e., CD) was used to ensure that the connection has enough deformation capacity.
5.4.1 Analysis of Baseline Model
To estimate the behavior of tension-controlled bolts on capacity and rotational stiffness of the connection, two different IDEA StatiCa models were developed for the baseline model using two different bolt types: 1) bearing, and 2) friction. Mill certificate material properties (See Table 5.2) were introduced in the software, and the overstrength coefficients, Ry and Rt, and all LRFD resistance factors were set to 1.0. A beam-column frame model was developed using SAP2000 with the lengths of the column and beam in the test setup, and the forces at column centerline were obtained. Using “Loads in equilibrium option”, stress-strain analysis (EPS) was performed to calculate the capacity of the baseline model. The loads were gradually increased until any of the following is achieved:
- 5% of plastic strain in plates (beam, column, shear tab, continuity plate)
- 100% strength capacity in bolts
- 100% strength capacity in welds
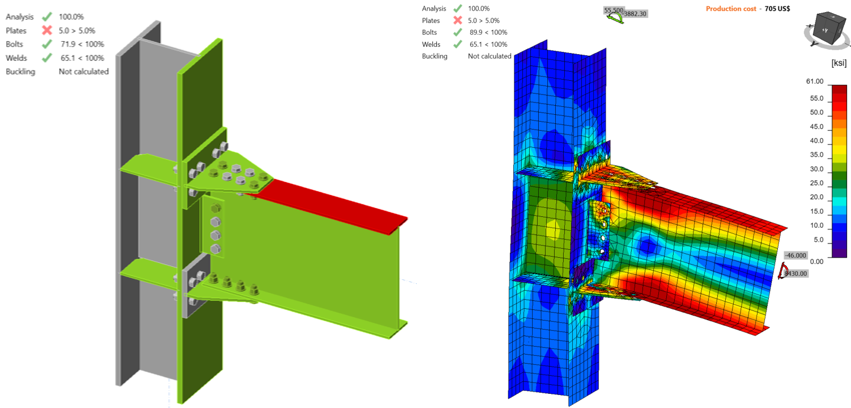
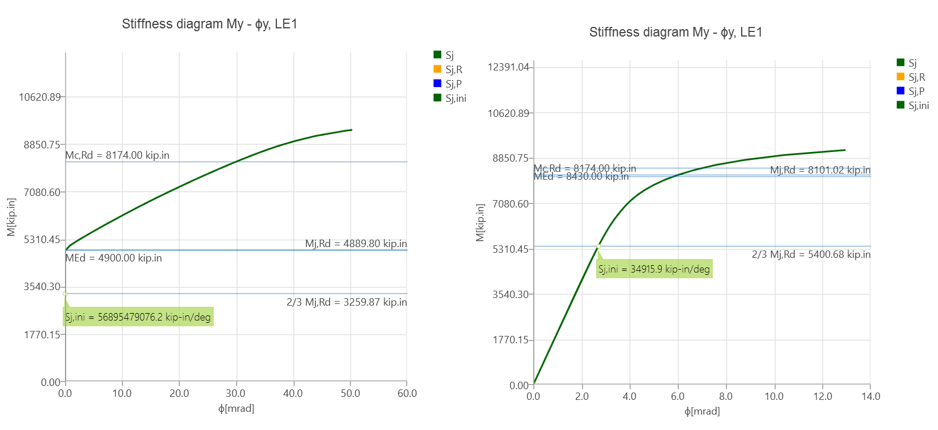
From the IDEA StatiCa analysis of the model created with friction type bolts, it was observed that the bolt strength capacity was achieved when the applied shear force and moment reached 26.70 kips and 4,900 kips-in., respectively (Figure 5.12). The second model was developed by switching “shear force transfer” option from “friction” to “bearing - tension/shear interaction” for T-stubs and shear tab. Also, “deformation at bolt hole at service load is a design consideration” option (under code setup) was turned off. An incremental loading was applied to the connection (proportionally with all loads being in equilibrium), it was observed that 5% of plastic limit strain was achieved on the beam flange when the shear force and the corresponding moment values reached 46.00 kips and 8,430, respectively (Figure 5.13). Analysis type was switched to stiffness analysis (e.g., “ST”), and moment-rotation relationship was computed for each model as shown in Figure 5.14.
Figure 5.12: IDEA StatiCa model for Baseline model (with friction bolts) under the moment of 4,900 kips-in.
Figure 5.13: IDEA StatiCa model for Baseline model (with bearing bolts) under the moment of 8,430 kips-in.
Figure 5.14: Left) Moment-rotation relationship for baseline model with friction bolts; right) moment-rotation relationship for baseline model with bearing bolts
Analysis type was switched to capacity design (e.g., “CD”) to check whether the connection has enough ductility when the plastic moment strength of the beam is achieved. To be able to perform this analysis, plastic moment of beam, location of plastic hinge and shear force at plastic hinge location are required to be calculated. According to Eq. 2.4-1 in AISC 341 (2016), the probable maximum moment of beam at plastic hinge location, \(M_{p}\), is calculated as:
\(M_{p} = C_{pr}F_{y}R_{y}Z_{x}\) (5.1)
where \(Z_{x}\) is plastic section modulus of beam, \(F_{y}\) is yield stress of beam, \(R_{y}\) is ratio of the expected yield stress to the specified minimum yield stress, and \(C_{pr}\) is a factor to account for peak connection strength which is given by Eq. 2.4-2 in AISC 341 (2016) as:
\(C_{pr} = (F_{y} + F_{u})/(2F_{y}\) (5.2)
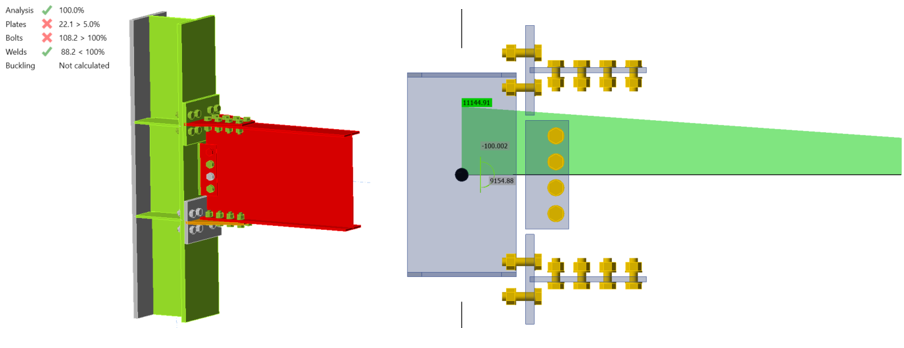
\(F_{u}\) is ultimate stress of beam. It is assumed that \(R_{y}\) is equal to 1.0 when using measured material properties. Using the mill certificate material properties and plastic section modulus of beam (134 in.3) given in Table 1.1 in AISC Manual (2017), \(C_{pr}\) and \(M_{p}\) were calculated using the properties given below as 1.12 and 9,154.88 kips-in. respectively. The distance of plastic hinge location from column centerline and the shear force at the plastic hinge location were calculated as 19.9 in. and 103 kips, respectively (see Appendix I) with an assumption that the distance between the column centerlines is equal to 30 ft. The calculated loads were applied at the beam position equal to 19.9 in. by setting loads as percentage of members in a way that are equal to the calculated plastic moment and shear force values as shown in Figure 5.15. The connection is inadequate, the T-stems are too weak (22.1% of plastic strain was reached in the top T-stem).
Figure 5.15: Capacity design analysis of baseline model
5.4.2 Analysis of Variation 1
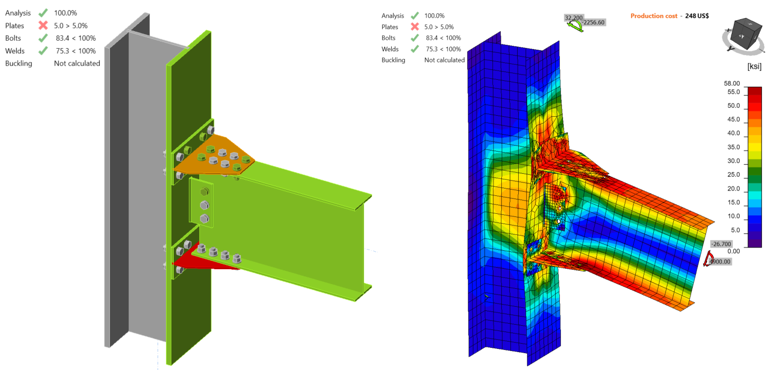
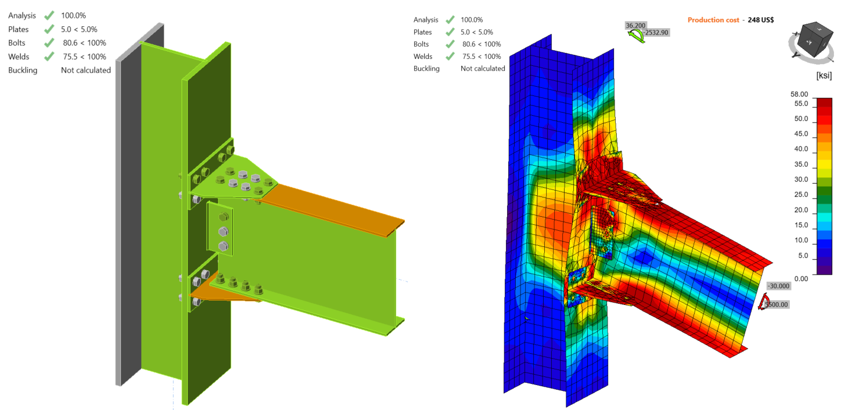
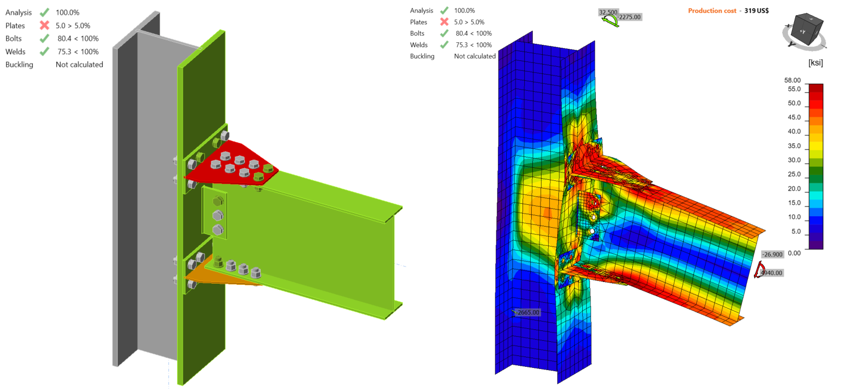
Two IDEA StatiCa models were developed for variation 1 for different measured material properties of T-stub. For the first model, mill certificate material properties were used for all members of the specimens whereas the second model was created using the coupon test material properties of T-stub flange. Following the same procedure described in the previous section, an incremental loading was applied. The first model reached its capacity with 5% of plastic strain in the T-stubs when the shear force and the corresponding moment values were 26.70 kips and 4,900 kips-in., respectively (Figure 5.16). The material properties of T-stubs were updated using coupon test properties and the same incremental loading procedure was followed. The same failure mode was observed when the shear force and the corresponding moment values reached 30,00 kips and 5,500 kips-in., respectively (Figure 5.17).
Figure 5.16: IDEA StatiCa model for variation 1 (Mill) under the moment of 4,900 kips-in.
Figure 5.17: IDEA StatiCa model for variation 1 (Coupon) under the moment of 5,500 kips-in.
5.4.3 Analysis of Variation 2
Following the same procedure, two IDEA StatiCa models were developed for variation 2. From the model developed with the mill certificate properties, it was observed that T-stub reached the plastic strain limit (i.e., 5.0%) when the applied shear force and moment were 26.90 kips and 4,940 kips-in., respectively (Figure 5.18). After the material properties of T-stub were switched to coupon test properties, a higher flexural moment capacity was calculated as 5,730 kips-in. with the corresponding 31.20 kips shear force (Figure 5.19). The failure mode remained the same.
Figure 5.18: IDEA StatiCa model for variation 2 (Mill) under the moment of 4,940 kips-in.
Figure 5.19: IDEA StatiCa model for variation 2 (Coupon) under the moment of 5,730 kips-in.
5.4.4 Analysis of Variation 3
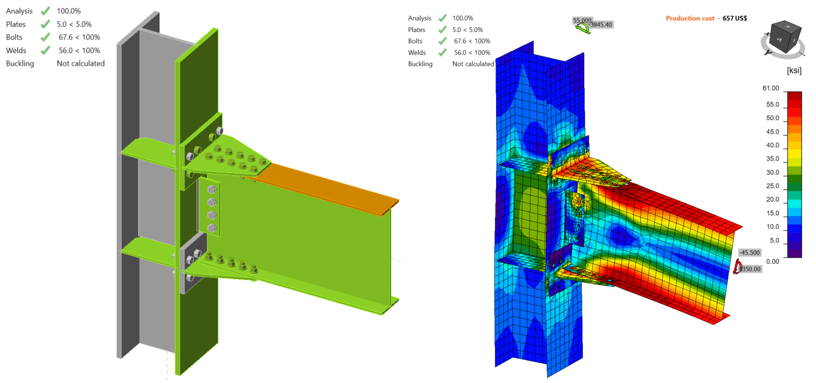
For variation 3, the IDEA StatiCa model was developed using mill certificate material properties. When the shear force and the corresponding moment reached 45.50 kips and 8,350 kips-in., respectively, 5% of plastic strain was achieved on the beam flange (Figure 5.20).
Figure 5.20: IDEA StatiCa model for variation 3 under the moment of 8,350 kips-in.
5.4.5 Analysis of Variation 4
The IDEA StatiCa model was created for variation 4 using mill certificate material properties. 5% of plastic strain was captured on the beam flange when the shear force and the corresponding moment were 45.50 kips and 8,350 kips-in., respectively (Figure 5.21).
Figure 5.21: IDEA StatiCa model for variation 4 under the moment of 8,350 kips-in.
5.4.6 Analysis of Variation 5
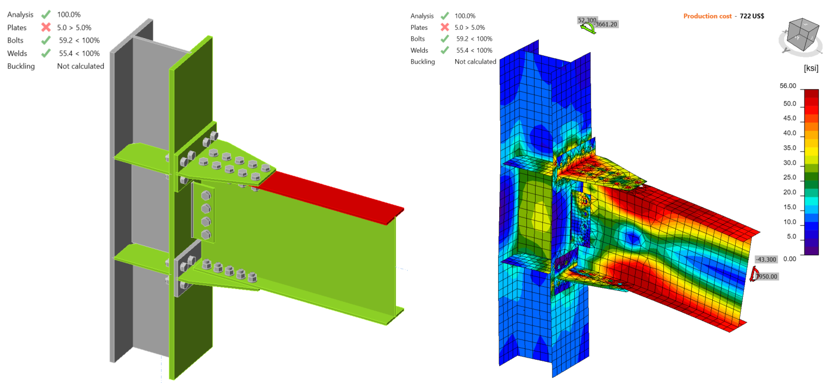
Following the same procedure, IDEA StatiCa analysis was performed for variation 5. Mill certificate material properties were used for all members of the connection. 5% of plastic strain was achieved on the beam flange when the shear force and the corresponding reached 48.40 kips and 7,950 kips-in., respectively (Figure 5.22).
Figure 5.22: IDEA StatiCa model for variation 5 under the moment of 7,950 kips-in.
The moment capacities of double-tee moment connections with respect to column centerline, \(M_{y@cc}\), were obtained with IDEA StatiCa analysis. Moment capacities at the column face, \(M_{y@foc}\), were calculated using Eq. 5.3 and are presented in Table 5.5.
\(M_{y@foc} = M_{y@cc} - V_{g}\frac{d_{c}}{2}\) (5.3)
where \(V_{g}\) is shear force, and \(d_{c}\) is depth of column.
Table 5.5: Moment capacities calculated by IDEA StatiCa
| Specimen No | \(M_{y@cc}\) [kips-in.] | \(V_{g}\) [kips] | \(M_{y@foc}\) [kips-in.] |
| Baseline (Bearing) | 8,430 | 46.0 | 8,090 |
| Baseline (Friction) | 4,900 | 26.7 | 4,702 |
| Variation 1 (Mill) | 4,900 | 26.7 | 4,702 |
| Variation 1 (Coupon) | 5,500 | 30.0 | 5,278 |
| Variation 2 (Mill) | 4,940 | 26.9 | 4,741 |
| Variation 2 (Coupon) | 5,730 | 31.2 | 5,499 |
| Variation 3 | 8,350 | 45.5 | 8,013 |
| Variation 4 | 8,350 | 45.5 | 8,013 |
| Variation 5 | 7,950 | 43.3 | 7,630 |
5.5. ABAQUS Analysis
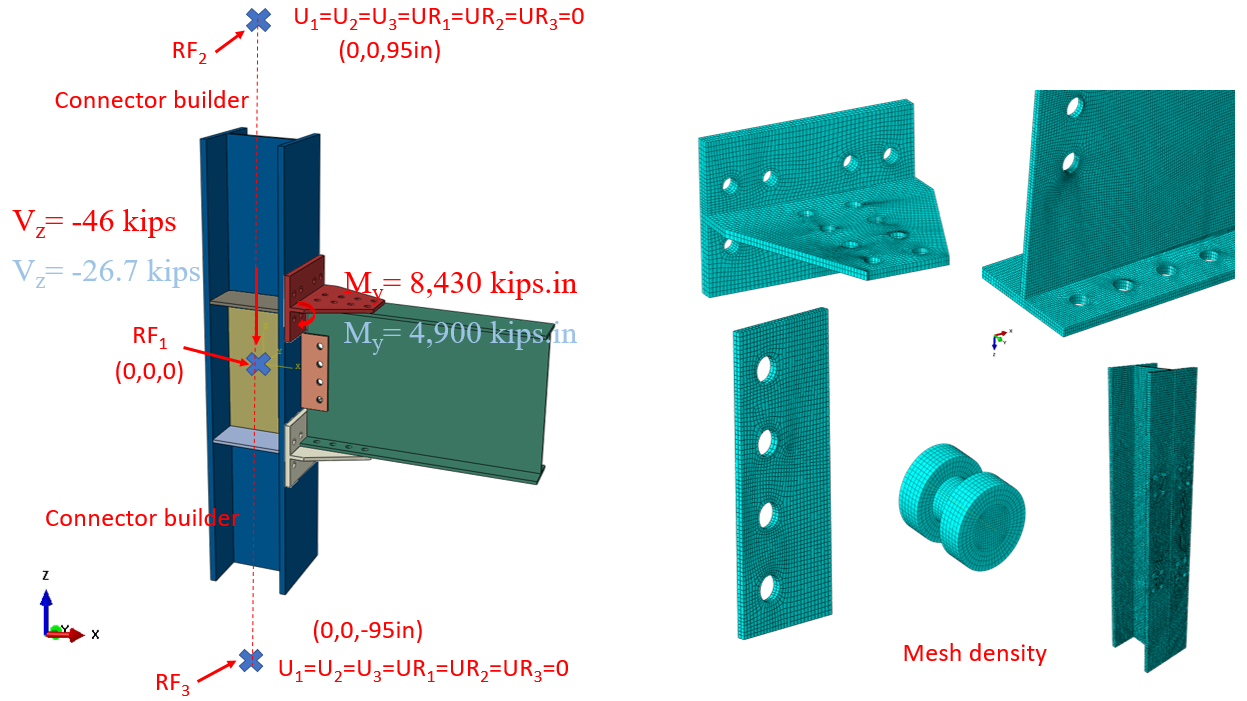
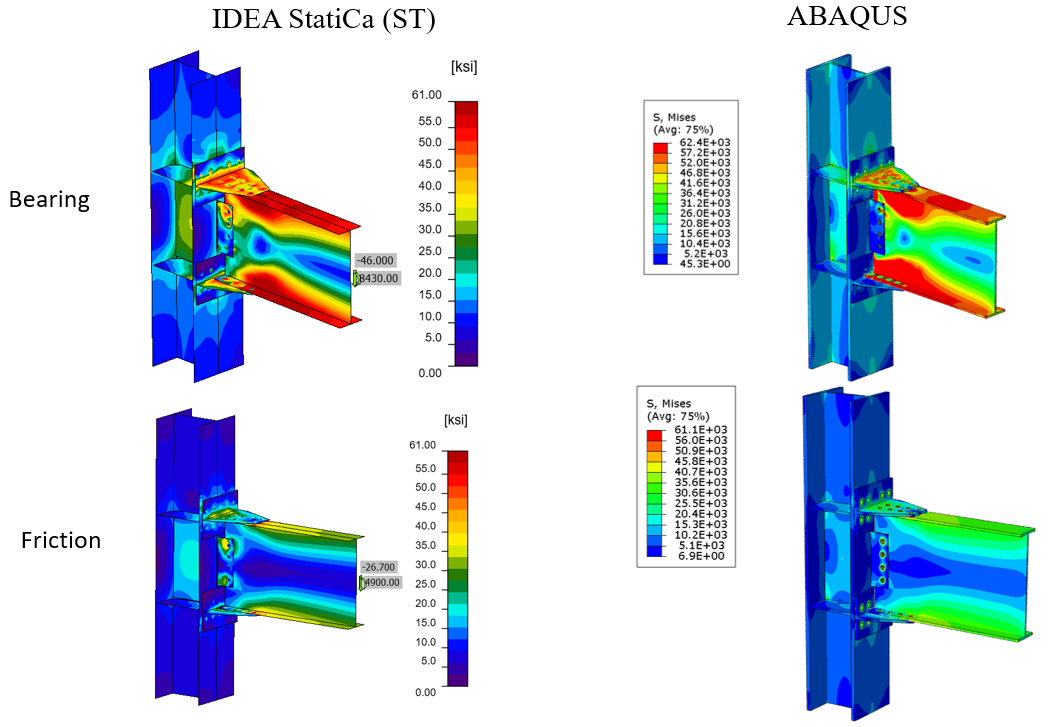
In this section, the baseline model developed in Section 5.4.1 was rebuilt using ABAQUS software (version 2022) for generic FE analysis and results were compared with IDEA StatiCa. The initial CAD model for the FE analysis was generated using the IDEA StatiCa’s viewer platform. The 36 bolts and two weld lines that connected the entire assembly were then added manually using the CAD interface in ABAQUS. Two bolt types were investigated in this section as described in Section 5.4.1. For the bearing type bolt, the vertical load of 46 kips and the corresponding moment of 8,430 kips-in. (around Y axis) were applied to a defined reference point (i.e., RF1) at the column centerline as shown in Figure 5.23. For the friction type bolt, the vertical load of 26.7 kips and the corresponding moment of 4,900 kips-in. (around Y axis) were applied to the same reference point (i.e., RF1). The analytical length of the column in IDEA StatiCa is 190 in. Therefore, to mimic the identical column length in ABAQUS, two other reference points (i.e., RF2 and RF3) were introduced 95 in. away from the center of the column along the Z axis in both directions (see Figure 5.23). These two reference points were fixed in all directions and were connected to the top and bottom faces of the column using the connector builder module in ABAQUS. Note that to simulate the friction bolt in IDEA StatiCa, pretention load was applied in ABAQUS model along the axis of each bolt’s shank. In ABAQUS, the element size was chosen to be between 0.1-0.3 in. after routine mesh sensitivity analysis, and a total of 387,893 elements were generated in the model. The 3D stress, 8-node linear brick reduced integration (i.e., C3D8R) was selected as element type. The tie constraint was applied between the two weld lines and the attaching parts. The material behavior was modeled using bi-linear plasticity in ABAQUS. Other parameters, including density, elastic modulus, and Poisson’s ratio were taken from the IDEA StatiCa materials library which was updated according to the mill certificates (see Table 5.2 ). The numerical simulation was carried out on 16 processors (16vCP & 64GB RAM) and took approximately 210 minutes to finish. Figure 5.24 compares the predicted von-Mises stress between IDEA StatiCa and ABAQUS for both bolt type scenarios.
Figure 5.23: Model setup and mesh density in ABAQUS
Figure 5.24: Comparison of the calculated von Mises stress between IDEA StatiCa and ABAQUS models; top row) bearing bolts assumption, bottom row) friction bolts assumption
The maximum predicted stress in IDEA StatiCa for the bearing type bolts was 62.4 ksi on the beam top flange (note that the IDEA StatiCa legend shows the design data) while the ABAQUS model shows similar stress at the same location. The maximum predicted stress in IDEA StatiCa for the friction type bolts was 61 ksi on the beam top flange while the ABAQUS model shows the stress of 61.1 ksi at the same location. The slightly different stress distribution is likely due to the consideration of the length of the column in ABAQUS and the way that boundary conditions were applied, utilization of finer mesh in the FE analysis, and the simplified CAD model in IDEA StatiCa. Note that the authors also investigated the potential effect of frictional behavior of the bolts on the results in the ABAQUS model by changing the friction coefficient from 0.3 to frictionless, however, the results were not sensitive to that parameter.
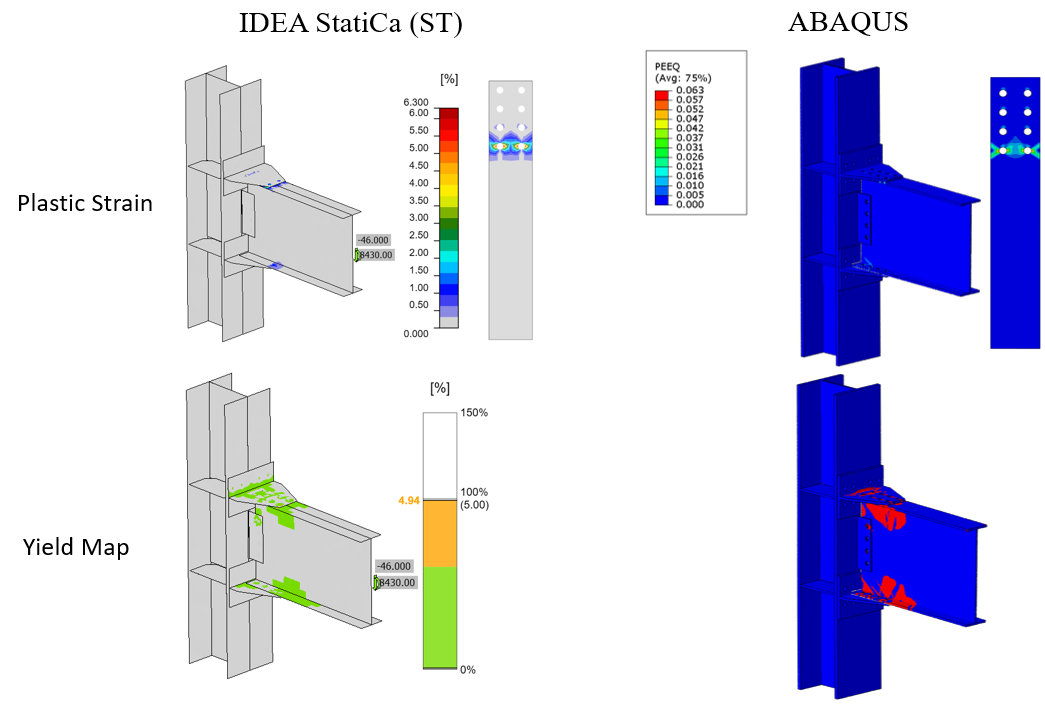
The maximum calculated plastic strain in IDEA StatiCa and ABAQUS for the bearing type bolt was 6.3% for both models (i.e., on the beam top flange as shown in Figure 5.25). Also, the predicted plastic deformation region by IDEA StatiCa was consistent with the calculated yield map in ABAQUS (i.e., the bottom row in Figure 5.25).
Figure 5.25: Bearing type bolts: Top row) Comparison of the calculated plastic strain between IDEA StatiCa and ABAQUS model; bottom row) comparison of the yield map between IDEA StatiCa and ABAQUS model
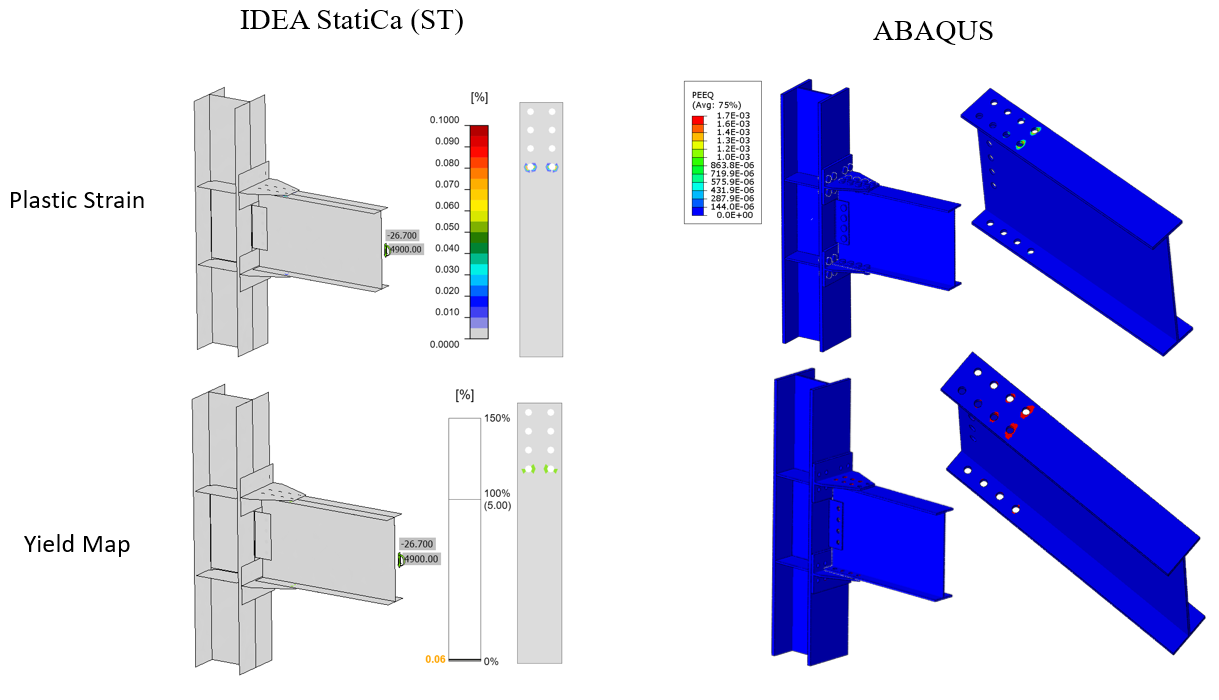
The maximum calculated plastic strain in IDEA StatiCa and ABAQUS for the friction type bolts were 0.1% and 0.17%, respectively (i.e., both on the beam top flange around the front bolt holes as indicated in Figure 5.26). Also, the predicted plastic deformation region by IDEA StatiCa was consistent with the calculated yield map in ABAQUS (i.e., the bottom row in Figure 5.26).
Figure 5.26: Friction type bolts: Top row) Comparison of the calculated plastic strain between IDEA StatiCa and ABAQUS model; Bottom row) Comparison of the yield map between IDEA StatiCa and ABAQUS model
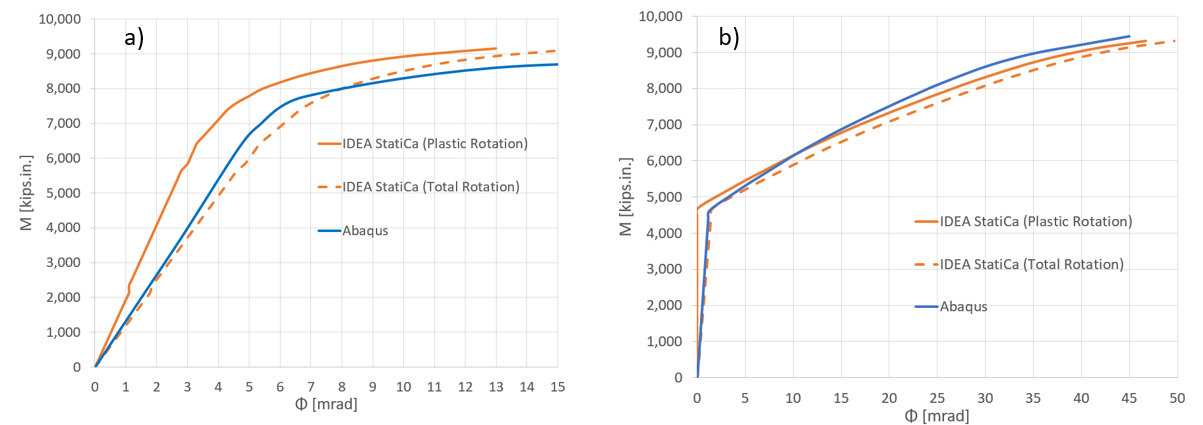
Figure 5.27 depicts the comparison of the moment-rotation curve between the two software with respect to the column centerline for both bolt types investigated in this section. Note that in Figure 5.27, to obtain the total rotation by IDEA StatiCa (shown by dashed orange line), the linear beam rotation at the column centerline was calculated using SAP2000 and then added to the default plastic rotation curve reported by IDEA StatiCa (shown by solid orange line). Both models offer comparable initial stiffness estimations. The minor discrepancy could be associated with the difference in the element types (i.e., solid element in ABAQUS versus shell element in IDEA StatiCa) and the employment of the tie constraint in ABAQUS to represent the welds.
Figure 5.27: Moment-rotation comparison between IDEA StatiCa and ABAQUS for a) bearing type bolts, b) friction type bolts
5.6 Summary and Comparison of Results
Six double-tee moment connections from experimental campaign were studied using IDEA StatiCa and following the AISC design procedure. Two different models were created for the baseline model to investigate the effects of using bearing and friction type bolts on moment capacity and moment rotation curve. Since the difference between the mill certificate and coupon test material properties was relatively high for variation 1 and variation 2, two different IDEA StatiCa models were developed for each of them. Mill certificate material properties were used for the rest of the specimens. In addition, for the baseline model, the moment rotation relationships calculated using IDEA StatiCa for each bolt type were compared with those from the equivalent ABAQUS models.
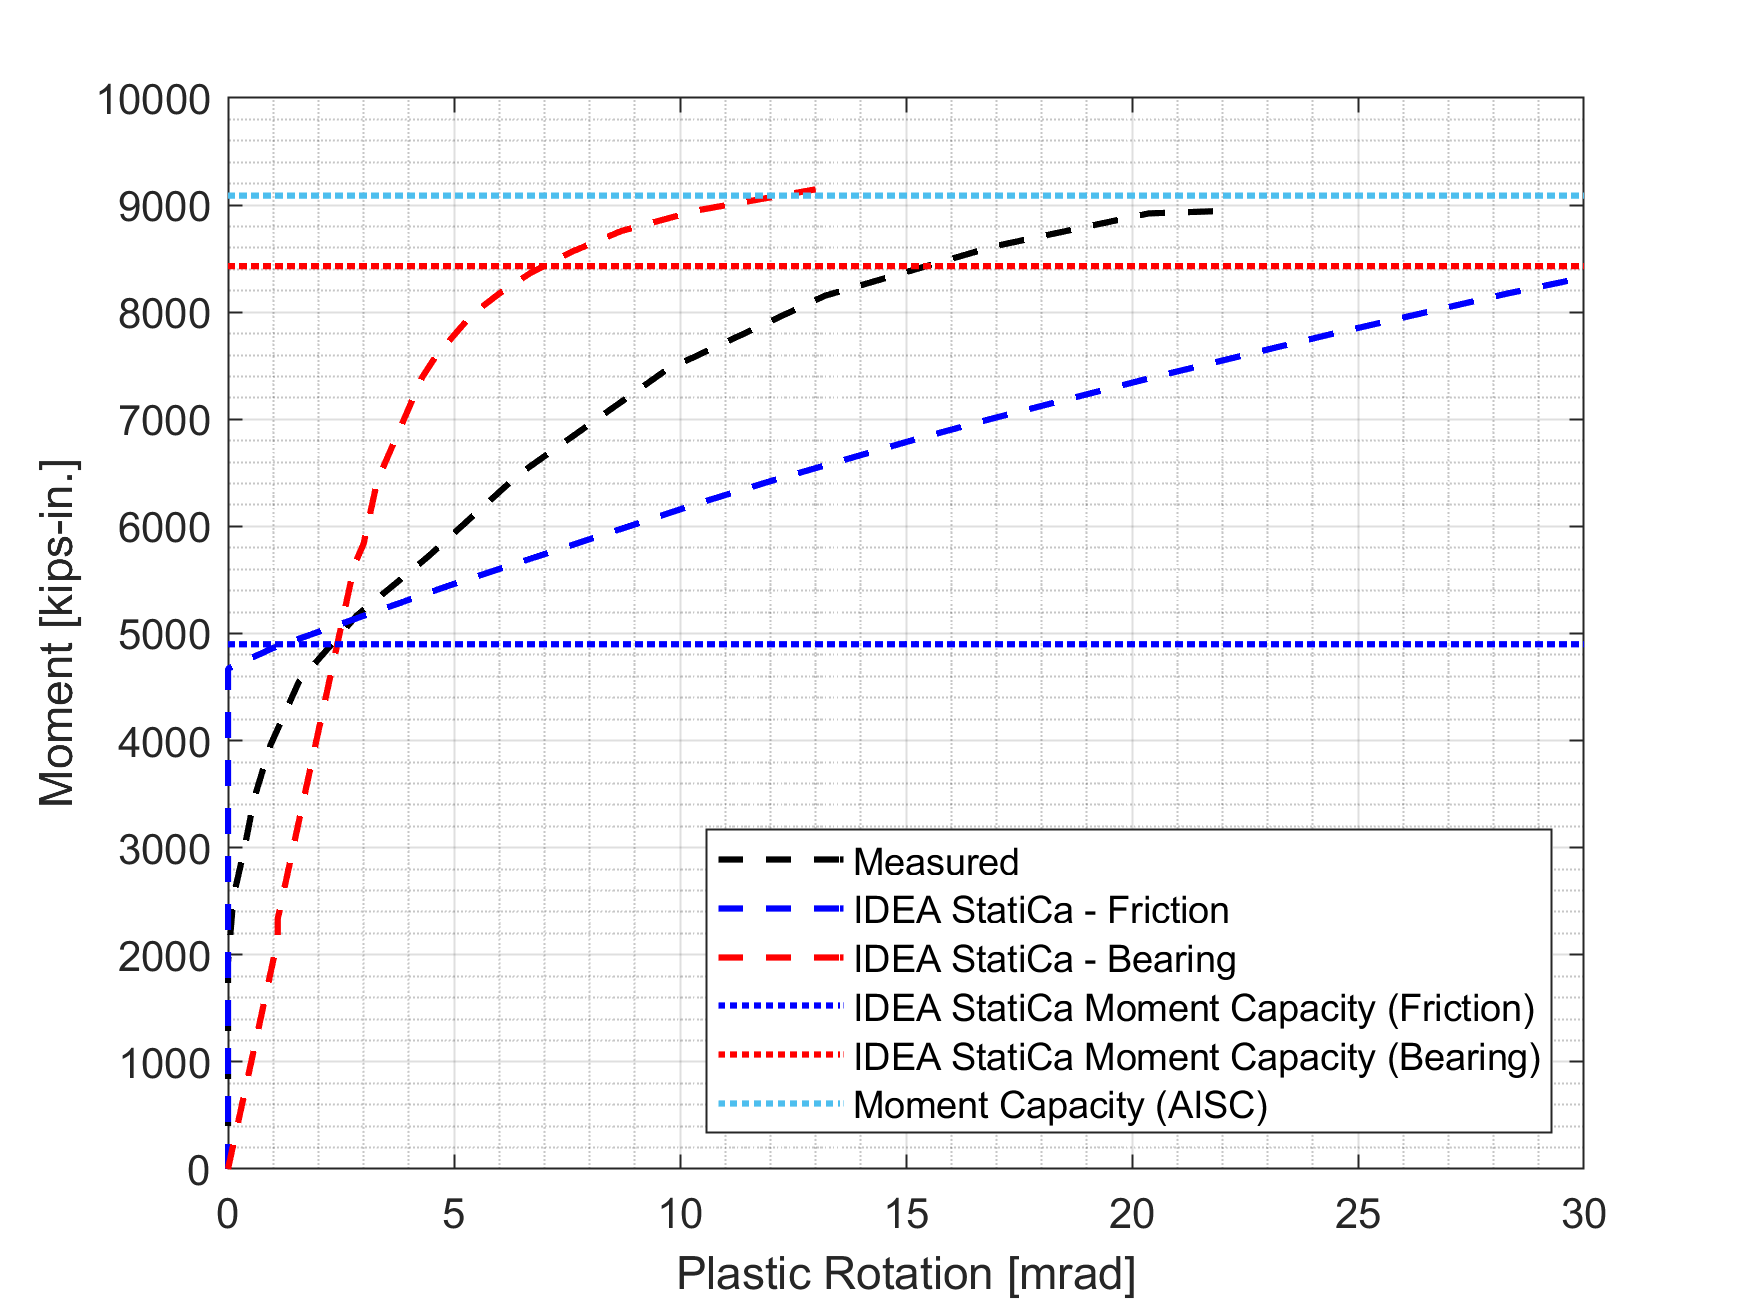
For the test of the baseline model, the failure mode was reported as local buckling of the beam. From the incremental loading of IDEA StatiCa analysis, it was observed that the model using friction bolts failed due to insufficient bolt slip strength while the failure occurred on the beam flange from the model that consists of bearing bolts. AISC design calculations show that plastic moment strength of beam was the controlling limit state. Since AISC 341 allows to design moment connections including tension-controlled based on their bearing strength capacity, it can be concluded that there is a good agreement on failure mode of the baseline model between observations from test, IDEA StatiCa analysis and AISC design procedure. In addition, the moment rotation curves obtained from both IDEA StatiCa models and the one provided in the test report are compared in Figure 5.28. It can be seen that the moment rotation relationship of the double-tee specimen having tension-controlled high strength A490 bolts fall within the curves calculated from IDEA StatiCa models developed with bearing bolts and friction bolts separately. Also, the capacity design analysis performed for the baseline model showed that T-stub and shear tab did not have sufficient strength. Similarly, both members did not satisfy the AISC design checks.
Figure 5.28: Moment rotation comparison
Variation 1 failed due to the net-section fracture of T-stub during the test. It was observed from the AISC design calculations that the controlling limit state was block shear of T-stem when mill certificate material properties were used while the controlling limit state became stem gross section yielding when coupon test material properties were used for T-stubs. Similarly, IDEA StatiCa analysis performed for both cases showed that insufficient T-stub strength was the failure mode of the specimen.
The experimental observations of variation 2 were similar to those of variation 1. The failure mode was reported as a net-section fracture of T-stub. Following the AISC design procedure, the controlling limit state was identified as block shear strength of T-stub when mill certificate material properties were introduced to all members. For the case that coupon test material properties were used for T-stub, stem gross section yielding was calculated as the controlling limit state. From both IDEA StatiCa analyses, it was observed that failure occurred in T-stub with 5.0% of plastic strain.
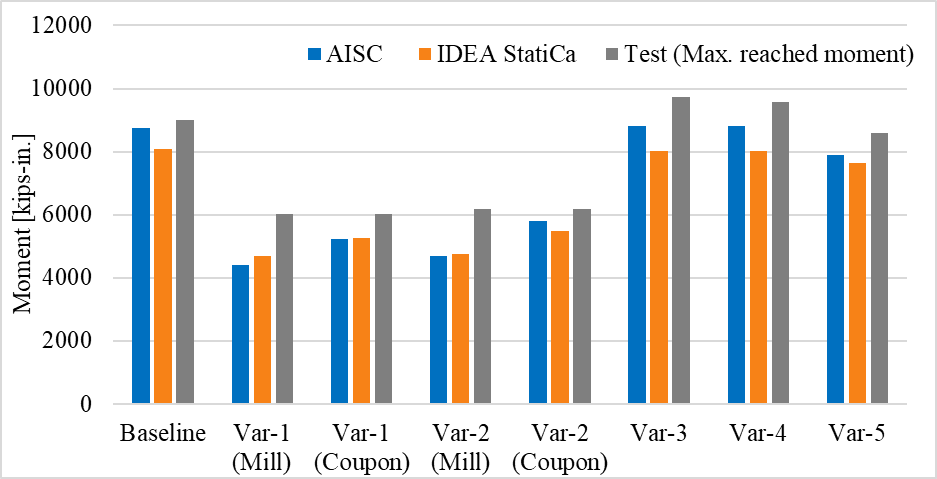
For variation 3, variation 4 and variation 5, the failure mode observed from the tests, AISC design procedure, and IDEA StatiCa analyses was the beam failure. Since the local buckling occurred during the cycle loads, no clear strength capacity was captured from the experiment. Although the specimens satisfied the buckling requirements (see Appendices I and J), the reason local buckling occurred during the experiments can be attributed to the inaccurate measured material properties provided in the test report. The calculated moment capacities using IDEA StatiCa and following AISC design procedure and the maximum reached moment values during the experiments are shown in Figure 5.29.
Figure 5.29: Moment capacity calculated by IDEA StatiCa and AISC procedure
Read the full study on prequalified connections!
References
Leon, R. T. (1999). Tests on T-stub connections-SAC phase II-Subtask 7.03. Georgia Institute of Technology.
Smallidge, J. M. (1999). Behavior of bolted beam-to-column T-stub connections under cyclic loading, Ph.D. Thesis, Georgia Institute of Technology, Atlanta, GA.
Swanson, J.A. (1999). Characterization of the Strength, Stiffness, and Ductility Behavior of
T-stub Connections, Ph.D. Thesis, Georgia Institute of Technology, Atlanta, GA.
AISC 358 (2016), “Prequalified Connections for Special and Intermediate Steel Moment Frames for Seismic Applications, including Supplement No. 1,” American Institute of Steel Construction ANSI/AISC 358-16, Chicago, Illinois.
AISC 360 (2016), “Specification for Structural Steel Buildings,” American Institute of Steel Construction ANSI/AISC 360-16, Chicago, Illinois.
AISC 341 (2016), “Seismic Provisions for Structural Steel Buildings,” American Institute of Steel Construction ANSI/AISC 341-16, Chicago, Illinois.
AISC Manual (2017), “Steel Construction Manual,” American Institute of Steel Construction, Chicago, Illinois.


