IDEA StatiCa Connection – Structural design of steel connections
Introduction to the CBFEM method
General introduction for the structural design of steel connections
Steel connection material model
Plate model and mesh convergence
Contacts between steel connection plates
Welded connections analysis
Bolts and preloaded bolts connections
Anchor bolts
Structural model of a concrete block
Analysis model of IDEA StatiCa
Steel joint analysis model
Node equilibrium in the 3D FEM model
Internal forces in the steel connections
Strength analysis of steel joints
Stiffness analysis and deformation capacity of steel joints
Steel connection capacity design
Steel connection design resistance
Steel joint buckling analysis
Analysis convergence of complex steel connection models
Steel-to-timber connections
Thin-walled steel members
Lateral-torsional restraint in structural design
Steel joints of hollow section cross-section members
Fatigue analysis type in structural design
Fire design
Weld sizing
Specifications for national codes
Check of components according to EN (Eurocode)
Check of components according to AISC (American standards)
Check of components according to CISC (Canadian standards)
Check of components according to AS (Australian standards)
Check of components according to SP (Russian standards)
Check of components according to IS 800 (Indian standards)
Check of components according to HKG (Hong Kong Code of Practice)
Check of components according to GB (Chinese standards)
Introduction to CBFEM method
General introduction for the structural design of steel connections
Introduction
Bar members are preferred by engineers when designing steel structures. However, there are many locations on the structure where the theory of members is not valid, e.g., welded joints, bolted connections, footing, holes in walls, the tapering height of cross-section and point loads. The structural analysis in such locations is difficult and it requires special attention. The behavior is non-linear and the nonlinearities must be respected, e.g., yielding of the material of plates, contact between end plates or base plate and concrete block, one-sided actions of bolts and anchors, welds. Design codes, e.g. EN1993-1-8, and also technical literature offer engineering solution methods. Their general feature is derivation for typical structural shapes and simple loadings. The method of components is used very often.
Component method
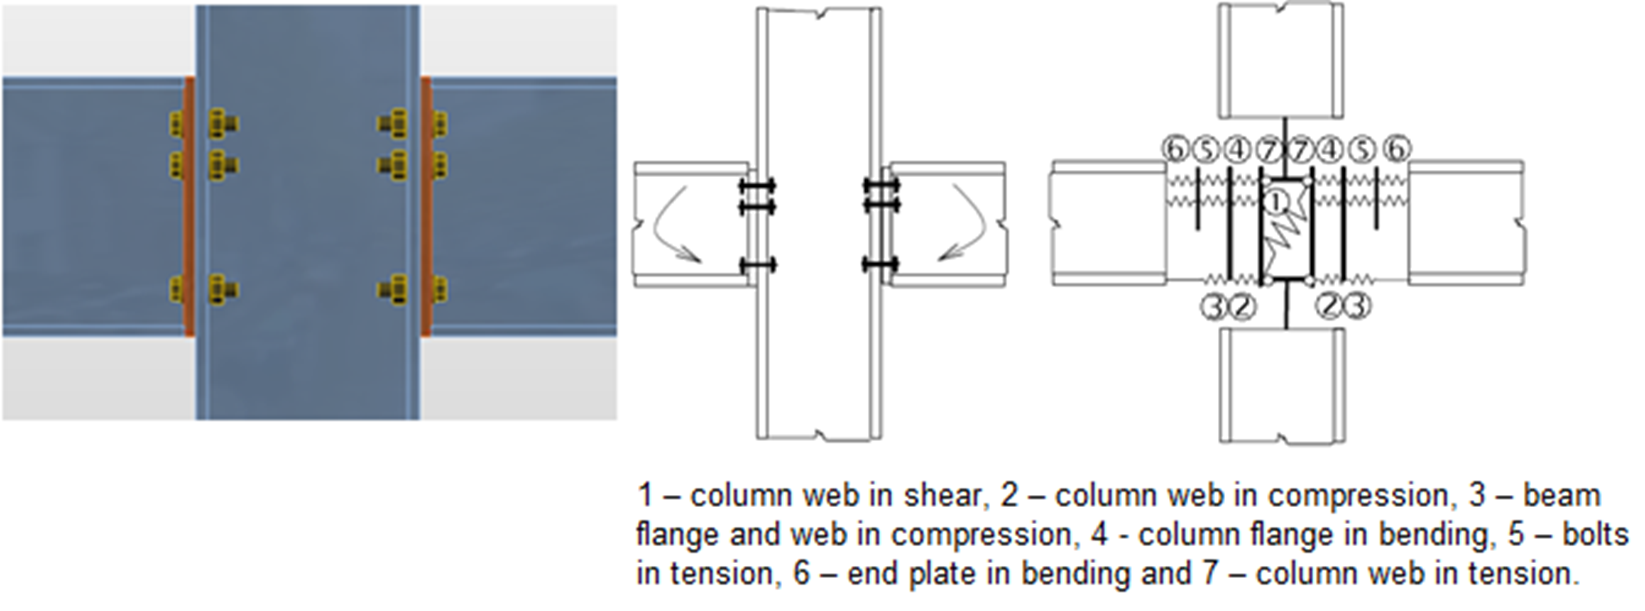
The component method (CM) solves the joint as a system of interconnected items – components. The corresponding model is built per each joint type to be able to determine forces and stresses in each component – see the following picture.
The components of a joint with bolted end plates modeled by springs
Each component is checked separately using corresponding formulas. As the proper model must be created for each joint type, the method usage has limits when solving joints of general shapes and general loads.
IDEA StatiCa together with a project team of Department of Steel and Timber Structures of Faculty of Civil Engineering in Prague and Institute of Metal and Timber Structures of Faculty of Civil Engineering of the Brno University of Technology, developed a method for advanced design of steel structural joints.
Component Based Finite Element Model (CBFEM) method is:
- General enough to be usable for most of the joints, footings, and details in engineering practice.
- Simple and fast enough in daily practice to provide results in a time comparable to current methods and tools.
- Comprehensive enough to provide structural engineer clear information about joint behavior, stress, strain, and reserves of individual components and about overall safety and reliability.
The CBFEM method is based on the idea that most of the verified and very useful parts of CM should be kept. The weak point of CM – its generality when analyzing stresses of individual components – was replaced by modeling and analysis using the Finite Element Method (FEM).
FEM is a general method commonly used for structural analysis. The usage of FEM for modeling of joints of any shapes seems to be ideal (Virdi, 1999). The elastic-plastic analysis is required, as the steel ordinarily yields in the structure. In fact, the results of the linear analysis are useless for joint design.
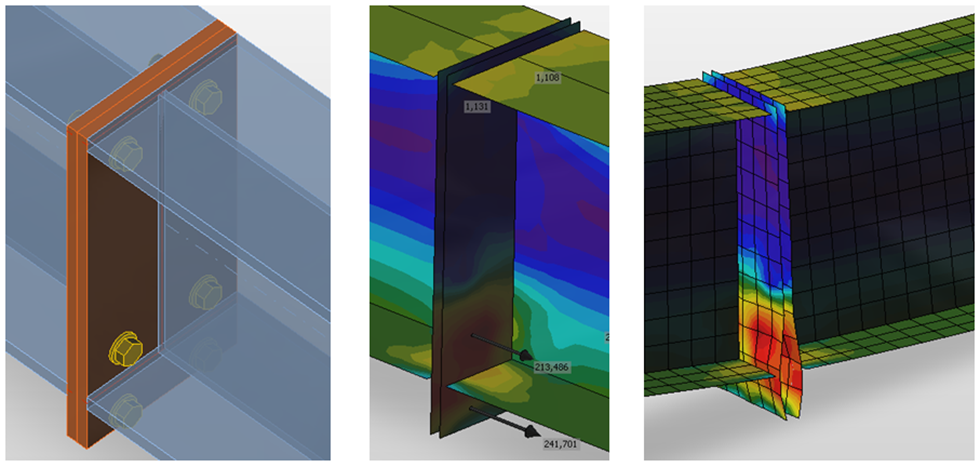
FEM models are used for research purposes of joint behavior, which usually apply spatial elements and measured values of material properties.
FEM model of a joint for research. It uses spatial 3D elements for both plates and bolts
Both webs and flanges of connected members are modeled using shell elements in the CBFEM model for which the known and verified solution is available.
The fasteners – bolts and welds – are the most difficult in the point of view of the analysis model. Modeling of such elements in general FEM programs is difficult because the programs do not offer the required properties. Thus, special FEM components had to be developed to model the welds and bolts behavior in a joint.
CBFEM model of bolted connection by end plates
Joints of members are modeled as massless points when analyzing steel frame or girder structure. Equilibrium equations are assembled in joints and internal forces on the ends of beams are determined after solving the whole structure. In fact, the joint is loaded by those forces. The resultant of forces from all members in the joint is zero – the whole joint is in equilibrium.
The real shape of a joint is not known in the structural model. The engineer only defines whether the joint is assumed to be rigid or hinged.
It is necessary to create a trustworthy model of joint, which respect the real state, to design the joint properly. The ends of members with the length of a 2-3 multiple of maximal cross-section height are used in the CBFEM method. These segments are modeled using shell elements.
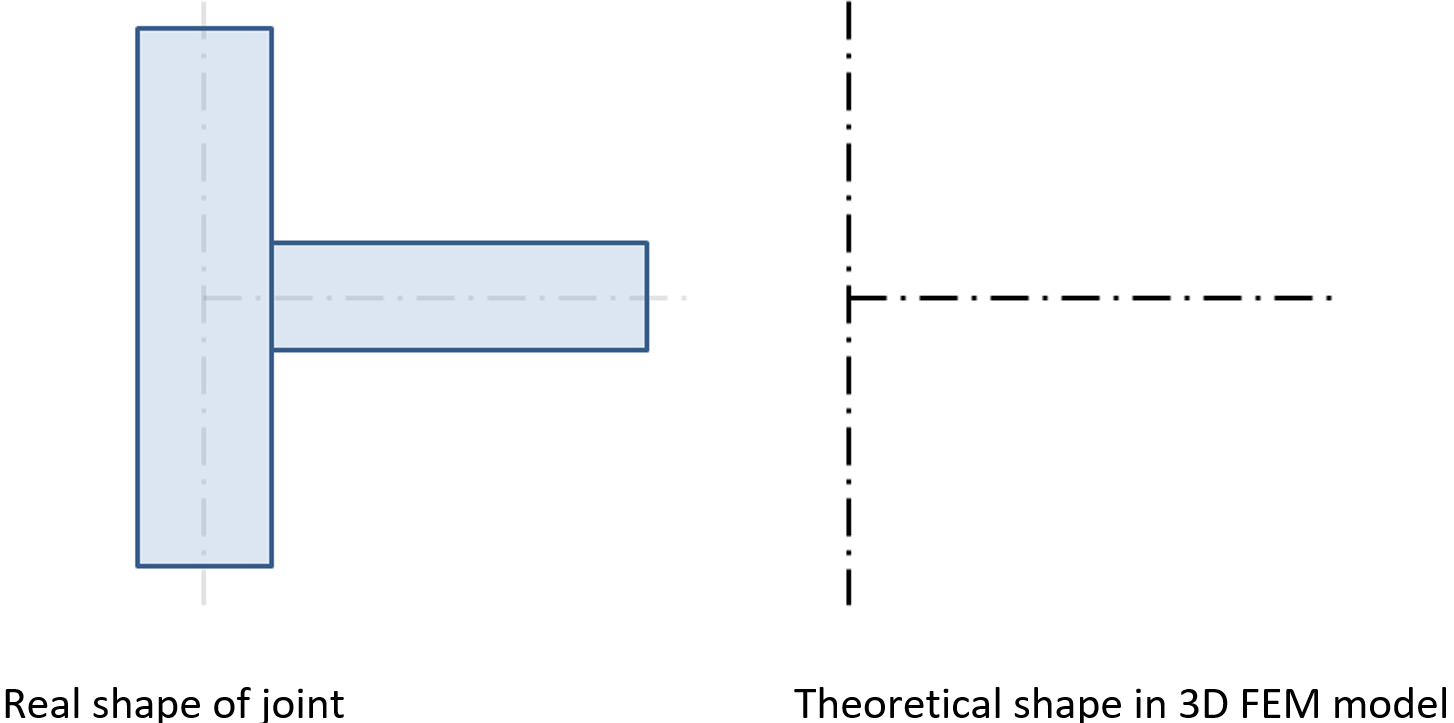
A theoretical (massless) joint and real shape of the joint without modified member ends
For better precision of the CBFEM model, the end forces on 1D members are applied as loads on the segment ends. Sextuplets of forces from the theoretical joint are transferred to the end of the segment – the values of forces are kept, but the moments are modified by the actions of forces on corresponding arms.
The segment ends at the joint are not connected. The connection must be modeled. So-called manufacturing operations are used in the CBFEM method to model the connection. Manufacturing operations are especially: cuts, offsets, holes, stiffeners, ribs, end plates and splices, cleats, gusset plates, and others. Fastening elements (welds and bolts) are also added.
IDEA StatiCa Connection can perform two types of analysis:
- Geometrically linear analysis with material and contact nonlinearities for stress and strain analysis,
- Eigenvalue analysis to determine the possibility of buckling.
In the case of connections, the geometrically nonlinear analysis is not necessary unless plates are very slender. Plate slenderness can be determined by eigenvalue (buckling) analysis. For the limit slenderness where geometrically linear analysis is still sufficient, see Chapter 3.9. The geometrically nonlinear analysis is not implemented in the software.
Want to improve your skills? Visit our Campus
Steel connection material model
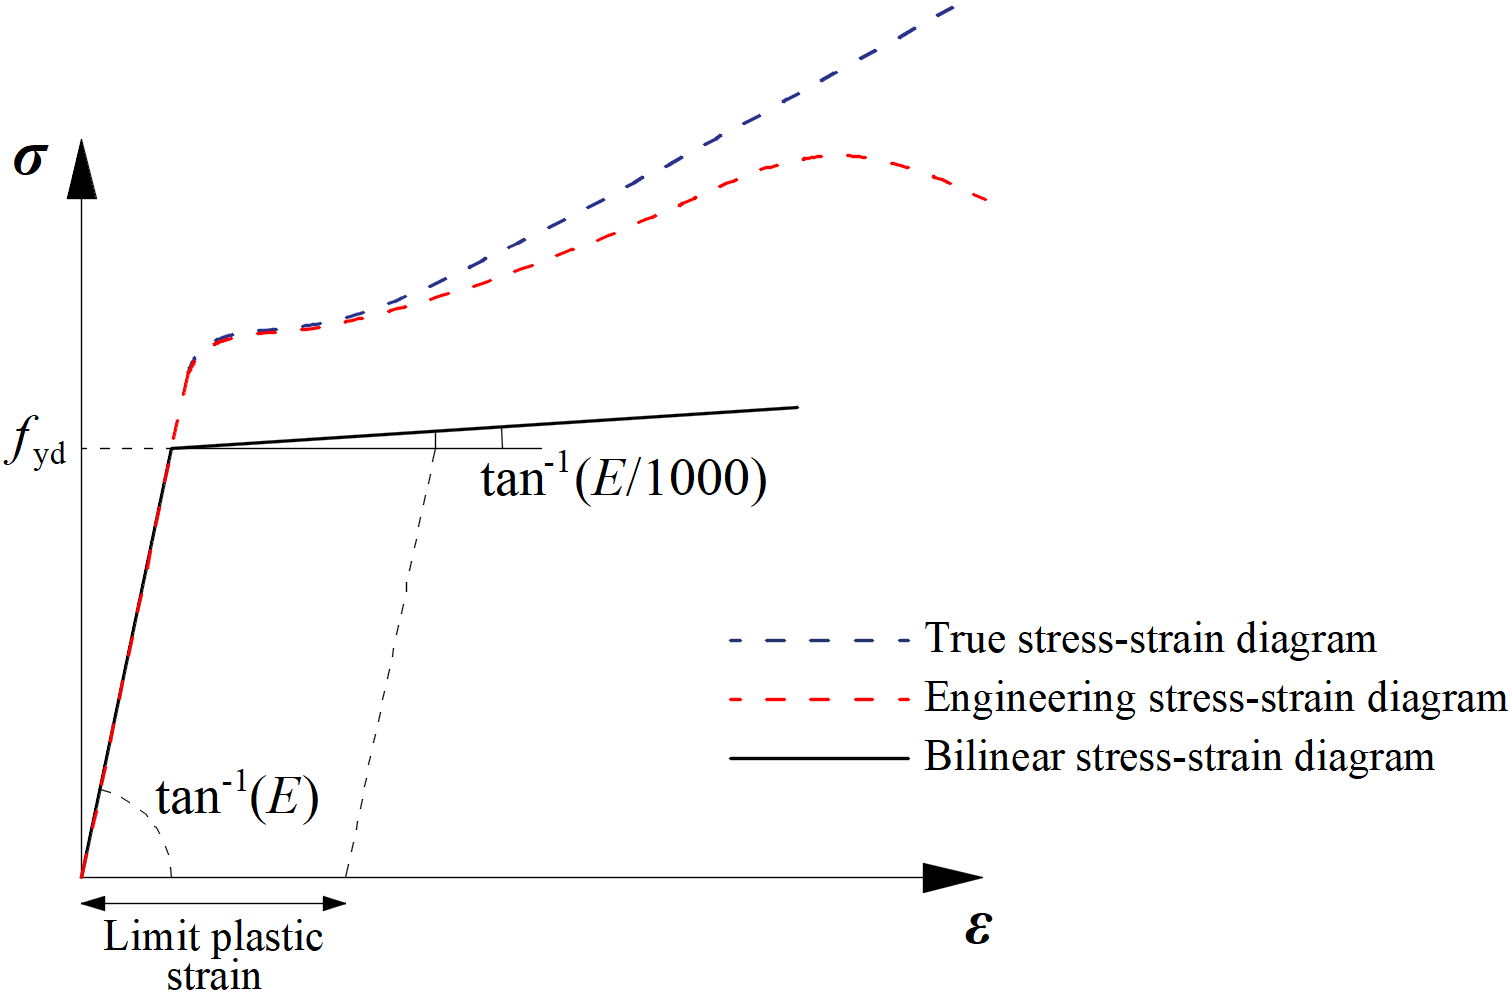
The most common material diagrams which are used in finite element modeling of structural steel are the ideal plastic or elastic model with strain hardening and the true stress-strain diagram. The true stress-strain diagram is calculated from the material properties of mild steels at an ambient temperature obtained in tensile tests. The true stress and strain may be obtained as follows:
\[ \sigma_{true}=\sigma (1 + \varepsilon) \]
\[ \varepsilon_{true}=\ln (1 + \varepsilon) \]
where σtrue is true stress, εtrue true strain, σ engineering stress, and ε engineering strain.
The plates in IDEA StatiCa Connection are modeled with elastic-plastic material with a nominal yielding plateau slope according to EN1993-1-5, Par. C.6, (2), tan-1 (E/1000). The material behavior is based on the von Mises yield criterion. It is assumed to be elastic before reaching the design yield strength, fyd.
The ultimate limit state criterion for regions not susceptible to buckling is reaching the limiting value of the principal membrane strain. The value of 5 % is recommended (e.g. EN1993-1-5, App. C, Par. C.8, Note 1).
Material diagrams of steel in numerical models
The limit value of plastic strain is often discussed. In fact, the ultimate load has low sensitivity to the limit value of plastic strain when the ideal plastic model is used. It is demonstrated in the following example of a beam to a column joint. An open section beam IPE 180 is connected to an open section column HEB 300 and loaded by bending moment. The influence of the limit value of plastic strain on the resistance of the beam is shown in the following figure. The limit plastic strain changes from 2 % to 8 %, but the change in moment resistance is less than 4 %.
An example of prediction of ultimate limit state of a beam to column joint
The influence of the limit value of plastic strain on the moment resistance
Plate model and mesh convergence
Increase in number of elements provides more precise results but at the cost of higher computational demand.
Plate model
Shell elements are recommended for modeling of plates in the FEA of structural connection. 4-node quadrangle shell elements with nodes at its corners are applied. Six degrees of freedom are considered in each node: 3 translations (ux, uy, uz) and 3 rotations (φx, φy, φz). Deformations of the element are divided into the membrane and the flexural components.
The formulation of the membrane behavior is based on the work by Ibrahimbegovic (1990). Rotations perpendicular to the plane of the element are considered. Complete 3D formulation of the element is provided. The out-of-plane shear deformations are considered in the formulation of the flexural behavior of an element based on Mindlin hypothesis. Our inhouse stabilised variant of Mindlin quad plate element with constat shear deforamtion along edge are applied. The elements are inspired by MITC4 elements; see Dvorkin (1984). The shell is divided into five integration layers through thickness of the plate at each integration point and plastic behavior is analyzed in each point. It is called Gauss–Lobatto integration. The nonlinear elastic-plastic stage of material is analyzed in each layer based on the known strains. Only the maximum stresses and strains of all layers are shown.
Mesh convergence
There are some criteria for the mesh generation in the connection model. The connection check should be independent of the element size. Mesh generation on a separate plate is problem-free. Attention should be paid to complex geometries such as stiffened panels, T-stubs, and base plates. The sensitivity analysis considering mesh discretization should be performed for complicated geometries.
All plates of a beam cross-section have a common division into elements. The size of generated finite elements is limited. The minimal element size is set to 10 mm and the maximal element size to 50 mm (can be set in Code setup). Meshes on flanges and webs are independent of each other. The default number of finite elements is set to 8 elements per cross-section height as shown in the following figure. The user can modify the default values in Code setup.
The mesh on a beam with constraints between the web and the flange plate
The mesh of the end plates is separate and independent of other connection parts. Default finite element size is set to 16 elements per cross-section height as shown in the figure.
The mesh on an end plate with 7 elements along its width
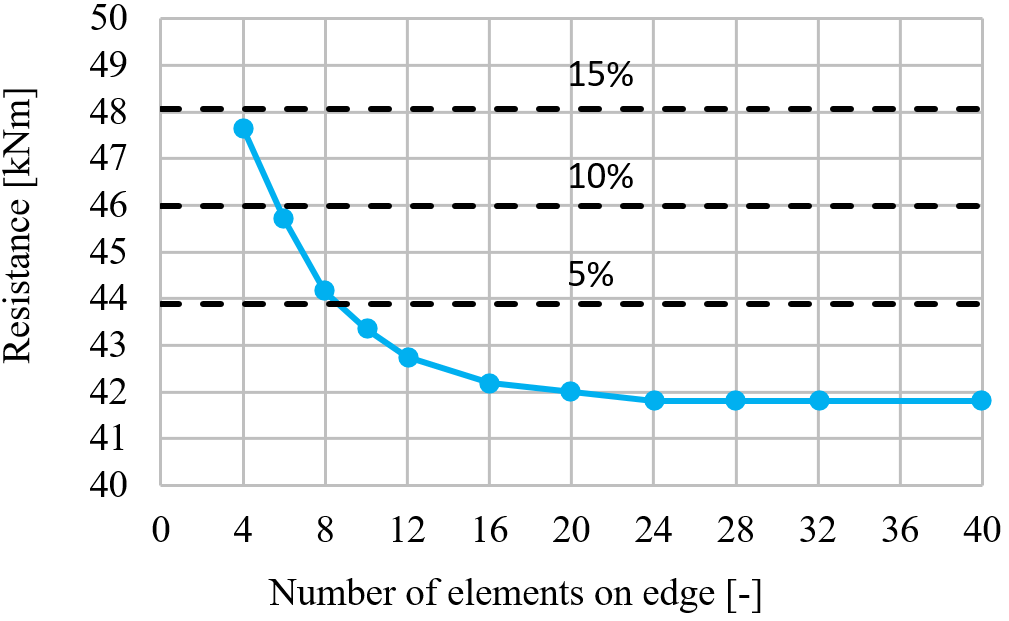
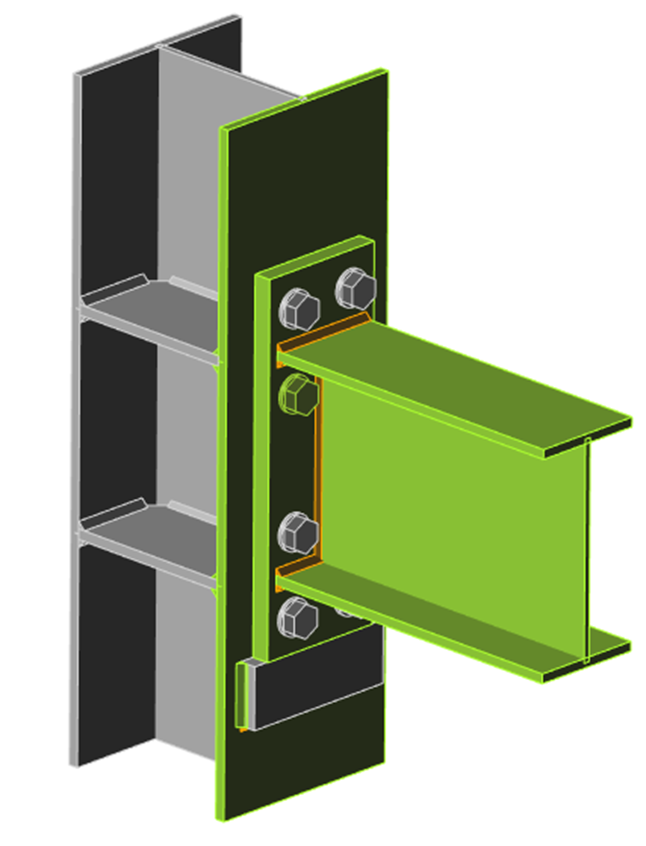
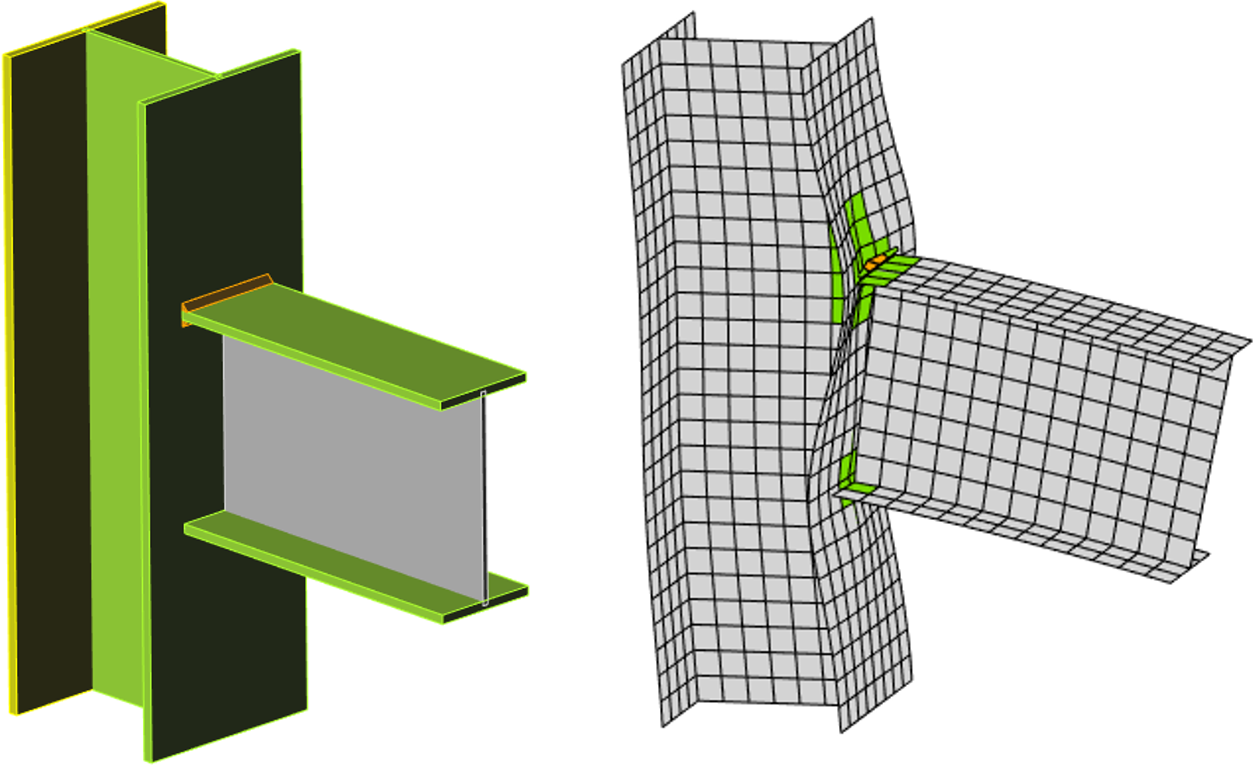
The following example of a beam to column joint shows the influence of mesh size on the moment resistance. An open section beam IPE 220 is connected to an open section column HEA 200 and loaded by a bending moment as shown in the following figure. The critical component is the column panel in shear. The number of the finite elements along the cross-section height varies from 4 to 40 and the results are compared. Dashed lines are representing the 5%, 10%, and 15% difference. It is recommended to subdivide the cross-section height into 8 elements.
A beam to column joint model and plastic strains at ultimate limit state
The influence of the number of elements on the moment resistance
The mesh sensitivity study of a slender compressed stiffener of column web panel is presented. The number of elements along the width of the stiffener varies from 4 to 20. The first buckling mode and the influence of a number of elements on the buckling resistance and critical load are shown in the following figure. The difference of 5% and 10% is displayed. It is recommended to use 8 elements along the stiffener width.
The first buckling mode and the influence of number of elements along the stiffener on the moment resistance
The mesh sensitivity study of a T-stub in tension is presented. Half of the flange width is subdivided into 8 to 40 elements, and the minimal element size is set to 1 mm. The influence of the number of elements on the T-stub resistance is shown in the following figure. The dashed lines are representing the 5%, 10%, and 15% difference. It is recommended to use 16 elements on the half of the flange width.
The influence of the number of elements on the T-stub resistance
Contacts between steel connection plates
The standard penalty method is recommended for modeling contact between plates. If penetration of a node into an opposite contact surface is detected, penalty stiffness is added between the node and the opposite plate. The penalty stiffness is controlled by a heuristic algorithm during the nonlinear iteration to get a better convergence. The solver automatically detects the penetration point and solves the contact force distribution between the penetrated node and nodes on the opposite plate. It allows the creation of contact between different meshes, as shown. The advantage of the penalty method is the automatic assembly of the model. The contact between the plates has a major impact on the redistribution of forces in connection.
An example of separation of plates in contact between the web and flanges of two overlapped Z sections purlins
It is possible to add contact between
- two surfaces,
- two edges,
- edge and surface.
An example of edge-to-edge contact between the seat and the end plate
An example of edge-to-surface contact between the lower flange of the beam and the column flange
The stresses in contacts may be visualized, and the values are shown in the check table of plates. However, the contact stresses are only informative and are not used in any check. Also, the through-thickness stress of shell elements is not considered.
Welded connections analysis
There exist several options for how to treat welds in numerical models. The large deformations make the mechanical analysis more complex, and it is possible to use different mesh descriptions, different kinetic and kinematic variables, and constitutive models. The different types of geometric 2D and 3D models and thereby finite elements with their applicability for different accuracy levels are generally used. The most often used material model is the common rate-independent plasticity model based on the von Mises yield criterion. Two approaches that are used for welds are described. Residual stress and deformation caused by welding are not assumed in the design model.
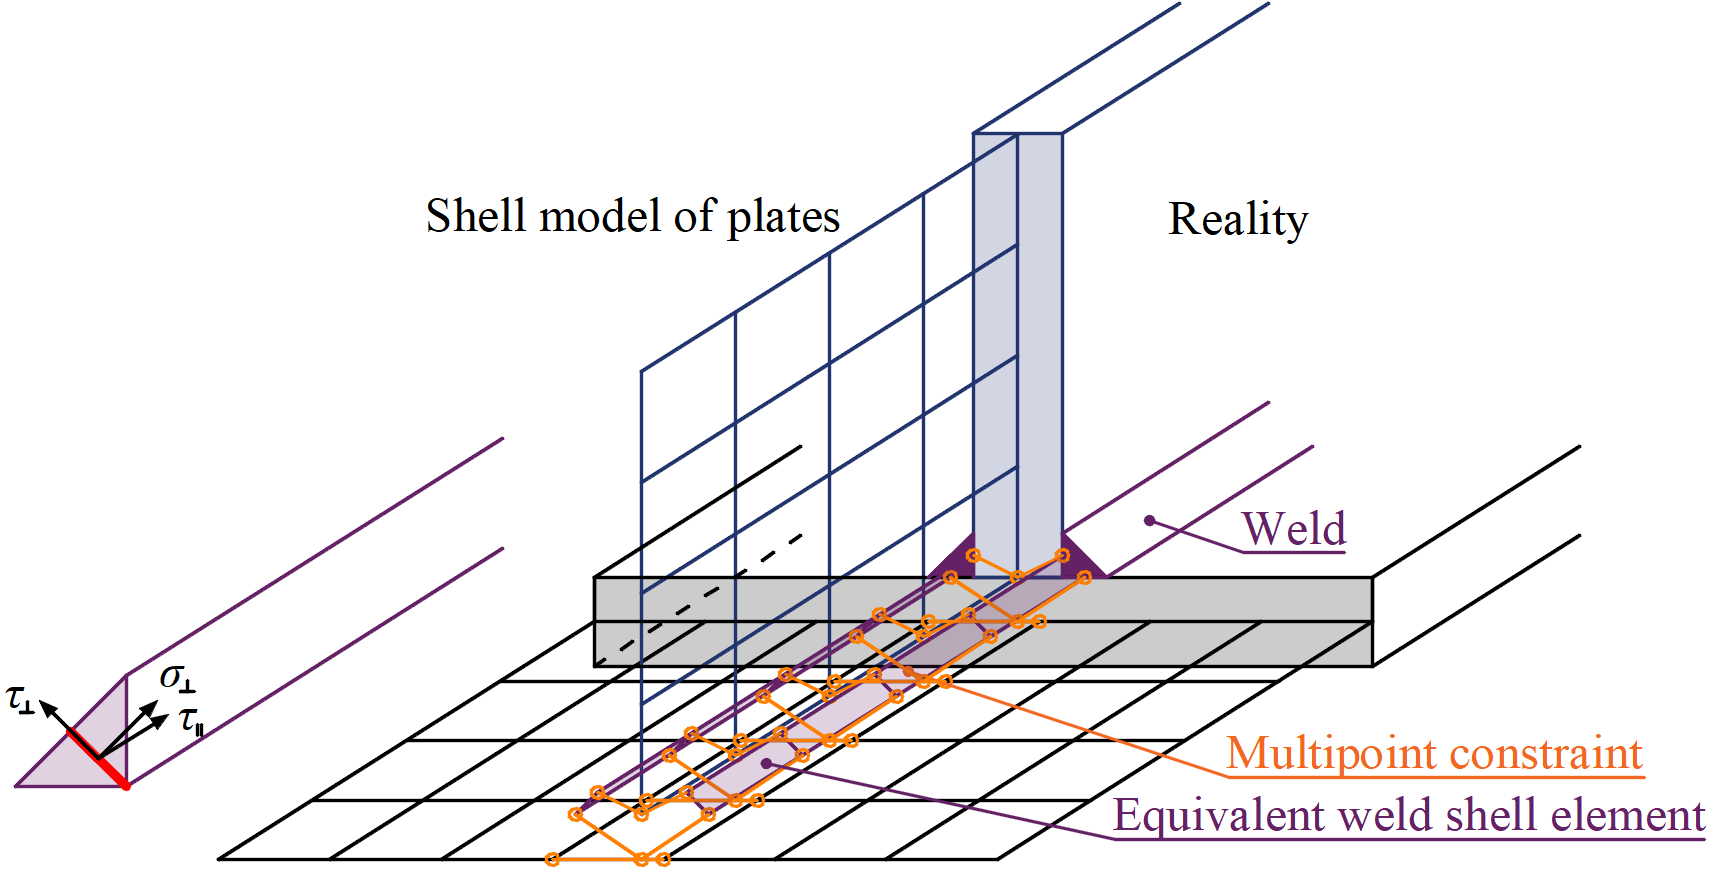
The load is transmitted through force-deformation constraints based on the Lagrangian formulation to the opposite plate. The connection is called multi-point constraint (MPC) and relates the finite element nodes of one plate edge to another. The finite element nodes are not connected directly. The advantage of this approach is the ability to connect meshes with different densities. The constraint allows modeling the midline surface of the connected plates with the offset, which respects the real weld configuration and throat thickness. The load distribution in the weld is derived from the MPC, so the stresses are calculated in the throat section. This is important for the stress distribution in the plate under the weld and for modeling of T-stubs.
Plastic stress redistribution in welds
The model with only multi-point constraints does not respect the stiffness of the weld, and the stress distribution is conservative. Stress peaks that appear at the end of plate edges, in corners, and rounding, govern the resistance along the whole length of the weld. To eliminate the effect, a special elastoplastic element is added between the plates. The element respects the weld throat thickness, position, and orientation. The equivalent weld solid is inserted with the corresponding weld dimensions. The nonlinear material analysis is applied, and elastoplastic behavior in equivalent weld solid is determined. The plasticity state is controlled by stresses in the weld throat section. The stress peaks are redistributed along the longer part of the weld length.
The elastoplastic model of welds gives real values of stress, and there is no need to average or interpolate the stress. Calculated values at the most stressed weld element are used directly for checks of the weld component. This way, there is no need to reduce the resistance of multi-oriented welds, welds to unstiffened flanges, or long welds.
Constraint between weld element and mesh nodes
General welds, while using plastic redistribution, can be set as continuous, partial, and intermittent. Continuous welds are over the whole length of the edge, partial allows users to set offsets from both sides of the edge, and intermittent welds can be additionally set with a set length and a gap.
Bolts and preloaded bolts connections
Bolts
In the Component-Based Finite Element Method (CBFEM), the bolt with its behavior in tension, shear, and bearing is the component described by the dependent nonlinear springs. Bolt assembly consists of bolt, washer, and nut and is simulated by a nonlinear spring, rigid body elements and gap elements.
Bolt in tension
The bolt in tension is described by spring with its initial axial stiffness, design resistance, initialization of yielding, and deformation capacity. The initial axial stiffness is derived analytically in the guideline VDI2230 and in Agerskov (1976).
\[D_{Lb} =\frac{L_s+0.4d_b}{EA_{s}}+ \frac{0.85d_b}{EA_{t}}\]
\[A_{pp}=\frac{0.75D_H(L_w-D_H)}{D_{W1}^2-D_{W2}^2}\]
\[A_{P1}=\frac{\pi}{4}(D_H^2-D_{W1}^2)\]
\[A_{P2}=\frac{1}{2}(D_{W2}^2-D_H^2)\tan^{-1}A_{pp}\]
\[A_P=A_{P1}+A_{P2}\]
\[D_{LW}=\frac{L_W}{EA_P}\]
\[k=\frac{1}{D_{LB}+D_{LW}}\]
where:
- \(d_b\) – bolt diameter
- \(D_H\) – bolt head diameter
- \(D_{W1}\) – washer inner diameter
- \(D_{W2}\) – washer outer diameter
- \(L_W\) – sum of washer thicknesses
- \(L_s\) – bolt grip length
- \(A_{s}\) – bolt gross area
- \(A_{t}\) – bolt tensile stress area
- \(E\) – Young's modulus of elasticity
The model corresponds to experimental data; see Gödrich et al. (2014). For the initialization of yielding and deformation capacity, it is assumed that plastic deformation occurs in the threaded part of the bolt shank only.
Force-deformation diagram for the bearing of the plate
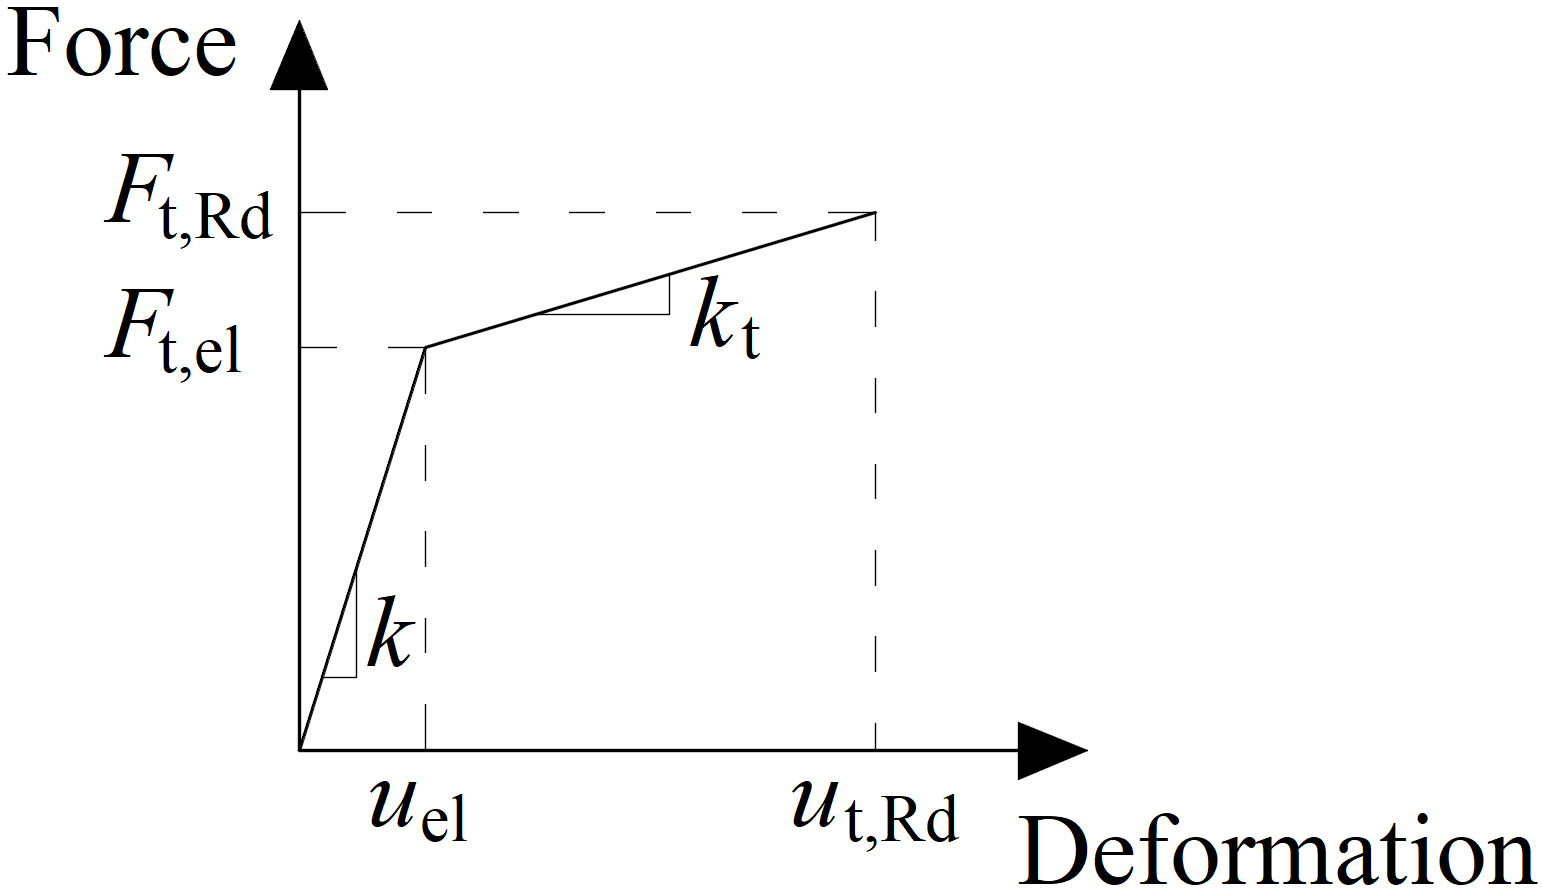
The force-deformation diagram is constructed using the following equations:
Plastic stiffness:
\[ k_t = c_1 k \]
Force at the elastic limit:
\[ F_{t,el} = \frac{F_{t,Rd}}{c_1 c_2 - c_1 +1} \]
Deformation at elastic limit:
\[ u_{el} = \frac{ F_{t,el} }{k} \]
Deformation at plastic limit:
\[ u_{t,Rd} = c_2 u_{el} \]
\[ c_1 = \frac{f_{ub} - f_{yb}}{\frac{1}{4} A E - f_{yb}} \]
\[ c_2 = \frac{AE}{4 f_{yb}} \]
where:
- \(F_{t,Rd}\) – bolt design resistance in tension
- \(f_{yb}\) – bolt yield strength
- \(f_{ub}\) – bolt ultimate strength
- \(A\) – elongation after fracture
Bolt in shear
Only the compression force is transferred from the bolt shank to the plate in the bolt hole. It is modeled by interpolation links between the shank nodes and holes edge nodes. The deformation stiffness of the shell element modeling the plates distributes the forces between the bolts and simulates the adequate bearing of the plate.
Bolt holes are considered as standard (default) or slotted (can be set in plate editor). Bolts in standard holes can transfer shear force in all directions, bolts in slotted holes have one direction excluded and can move in this selected direction freely.
The initial stiffness and the design resistance of a bolt in shear is defined by following formulas:
\[k_{el}=\frac{1}{\frac{1}{k_{11}}+\frac{1}{k_{12}}}\]
\[k_{11} = \frac{8d_b^2f_{ub}}{d_{M16}}\]
\[k_{12}=12k_td_bf_{up}\]
\[k_t=\min \left ( 2.5,\, \frac{1.5t_{min}}{d_{M16}} \right ) \]
\[k_{pl}=\frac{k_{el}}{1000}\]
where:
- \(d_b\) – bolt diameter
- \(f_{ub}\) – bolt ultimate strength
- \(d_{M16}=16 \textrm{ mm}\) – diameter of the reference bolt M16
- \(f_{up}\) – ultimate strength of the connected plate
- \(t_{min}\) – minimum thickness of the connected plate
The spring representing the bolt in shear has bi-linear force deformation behavior. Initialization of yielding is expected at:
\[F_{V,el}=0.999 F_{V,Rd}\]
Deformation capacity is considered as:
\[\delta_{pl}=\delta_{el}\]
where:
- \(F_{V,el}\) – bolt in shear elastic resistance
- \(F_{V,Rd}\) – bolt in shear resistance
- \(\delta_{el}\) – bolt in shear elastic deformation
Interaction between tension and shear
Interaction of the axial and the shear force can be introduced directly in the analysis model. The distribution of forces reflects the reality better (see enclosed diagram). Bolts with a high tensile force take less shear force and vice versa.
Example of the interaction of axial and shear force (EC)
Preloaded bolts
Preloaded bolts are used in cases when minimization of deformation is needed. The tension model of a bolt is the same as for standard bolts. The shear force is not transferred via bearing but via friction between gripped plates.
The design slip resistance of a preloaded bolt is affected by an applied tensile force.
IDEA StatiCa Connection checks the pre-slipping limit state of preloaded bolts. If there is a slipping effect, bolts do not satisfy the check. Then the post-slipping limit state should be checked as a standard bearing check of bolts where bolt holes are loaded in bearing and bolts in shear.
The user can decide which limit state will be checked. Either it is resistance to major slip or post-slipping state in shear of bolts. Both checks on one bolt are not combined in one solution. It is assumed that the bolt has a standard behavior after a major slip and can be checked by the standard bearing procedure.
The moment load of connection has a small influence on the shear capacity. Nevertheless, a friction check on each bolt simply is solved separately. This check is implemented in FEM component of the bolt. There is no information in a general way on whether the external tension load of each bolt is from the bending moment or from the tension load of the connection.
Stress distribution in standard shear bolt connection
Stress distribution in slip-resistant shear bolt connection
Anchor bolts
The anchor bolt is modeled with similar procedures as the structural bolts. The bolt is fixed on one side of the concrete block. Its length, Lb, used for bolt stiffness calculation, is taken as a sum of half of the nut thickness, washer thickness, tw, base plate thickness, tbp, grout or gap thickness, tg, and free the length embedded in concrete which is expected as 8d where d is a bolt diameter. Factor 8 is editable in the Code setup. This value is in accordance with the Component Method (EN1993-1-8); the free length embedded in concrete can be modified in Code setup. The stiffness in tension is calculated as k = E As / Lb. The load-deformation diagram of the anchor bolt is shown in the following figure. The values according to ISO 898:2009 are summarized in the table and in the formulas below.
Load–deformation diagram of the anchor bolt
\[ F_{t,el}=\frac{F_{t,Rd}}{c_1 c_2 - c_1 + 1} \]
\[ k_t = c_1 k; \qquad c_1 = \frac{R_m - R_e}{\left ( \frac{1}{4} A - \frac{R_e}{E} \right )E} \]
\[ u_{el} = \frac{F_{t,el}}{k}; \qquad u_{t,Rd} = c_2 u_{el}; \qquad c_2 = \frac{AE}{4R_e} \]
where:
- A – elongation
- E – Young's modulus of elasticity
- Ft,Rd – steel tensile resistance of the anchor
- Rm – ultimate (tensile) strength
- Re – yield strength
The stiffness of the anchor bolt in shear is taken as the stiffness of the structural bolt in shear.
Anchor bolts with stand-off
Anchors with stand-off can be checked as a construction stage before the column base is grouted or as a permanent state. Anchor with stand-off is designed as a bar element loaded by shear force, bending moment, and compressive or tensile force. The anchor is fixed on both sides; one side is 0.5×d below the concrete level, the other side is in the middle of the thickness of the plate. The buckling length is conservatively assumed as twice the length of the bar element. Plastic section modulus is used. The forces in anchor with stand-off are determined using finite element analysis. The bending moment is dependent on the stiffness ratio of anchors and base plate.
Anchors with stand-off – determination of lever arm and buckling lengths; stiff anchors are safe assumption
Structural model of a concrete block
Design model
In CBFEM, it is convenient to simplify the concrete block as 2D contact elements. The connection between the concrete and the base plate resists in compression only. Compression is transferred via the Winkler-Pasternak subsoil model, representing deformations of the concrete block. The tension force between the base plate and concrete block is carried by the anchor bolts. The shear force is transferred by friction between a base plate and a concrete block, by shear key and by bending of anchor bolts and friction. The resistance of bolts in shear is assessed analytically. Friction and shear key are modeled as a full single point constraint in the plane of the base plate – concrete contact.
Deformation stiffness
The stiffness of the concrete block may be predicted for the design of column bases as an elastic hemisphere. A Winkler-Pasternak subsoil model is commonly used for a simplified calculation of foundations. The stiffness of subsoil is determined using modulus of elasticity of concrete and the effective height of a subsoil as:
\[ k = \frac{E_c}{(\alpha_1 + \upsilon) \sqrt{\frac{A_{eff}}{A_{ref}}}} \left( \frac{1}{\frac{h}{a_2 d} + a_3}+a_4 \right) \]
where:
- k – stiffness of concrete subsoil in compression
- Ec – modulus of elasticity of concrete
- υ – Poisson's coefficient of the concrete block
- Aeff – effective area in compression
- Aref = 1 m2 – reference area
- d – base plate width
- h – concrete block height
- a1 = 1.65; a2 = 0.5; a3 = 0.3; a4 = 1.0 – coefficients
SI units must be used in the formula, the resulting unit is N/m3.
Transfer of shear load at the base plate
The shear load at the base plate can be transferred by three means:
- Friction
- Shear lug
- Anchors
Users can choose the mean by editing the base plate operation. No combination of means is allowed in the software, however, EN 1993-1-8 – Cl. 6.2.2 and Fib 58 – Chapter 4.2 allows for the combination of shear transfer by anchors and friction under certain conditions. In general, it is conservative to neglect friction in the anchorage design, although it may in some cases lead to an underestimation of concrete cracking at the serviceability level. As a rule, frictional resistance should be neglected if:
- the thickness of the grout layer exceeds one-half the anchor diameter,
- the anchorage capacity is governed by a near-edge condition,
- the anchorage is intended to resist earthquake loads.
The combination with a shear lug should never be allowed due to the deformation compatibility.
Transfer of shear load by friction
The shear resistance equals the resistance safety factor multiplied by friction coefficient editable in Code setup and compressive load. The compressive load includes all forces, e.g. in case of a column base loaded by compressive force and bending moment, the compressive load used for frictional shear resistance might be higher than the applied compressive force.
Transfer of shear load by shear lug
The shear lug is simulated as a stub encased in concrete under the base plate. The shear load is estimated to be transferred by uniform load distribution acting on the whole portion of the shear lug embedded in the concrete block, i.e. all nodes of the shear lug below the concrete surface are uniformly loaded. The portion of the shear lug above the concrete surface in grout is not assumed to transfer the shear load.
Be aware that the lever arm between the applied shear load (at the base plate) and the shear resistance (half-height of the shear lug embedded in concrete) causes a bending moment which must be transferred by compressive force in concrete and tensile forces in anchors.
The shear lug consists of shell finite elements and is checked as regular plates. Also, the welds of the shear lug to the base plate are checked using standard procedures in IDEA StatiCa Connection. Manual calculation usually assumes beam theory for the shear lug, although it is not accurate because the length to width ratio is very small for shear lug. Therefore, there might be a significant difference between IDEA StatiCa Connection and manual calculation.
Transfer of shear load by anchors
The shear resistance is determined by the shear resistance of anchors. The steel resistance of anchors have elastoplastic load-deformation curve, but the concrete failure modes are considered as perfectly brittle.
Analysis model of IDEA StatiCa
Steel joint analysis model
The CBFEM method (Component Based Finite Element Model) enables fast analysis of joints of several shapes and configurations. The model consists of members to which the load is applied and manufacturing operations (including stiffening members), which serve to connect members to each other. Members must not be confused with manufacturing operations because their cut edges are connected via rigid links to the connection node, so they are not deformed properly if used instead of manufacturing operations (stiffening members).
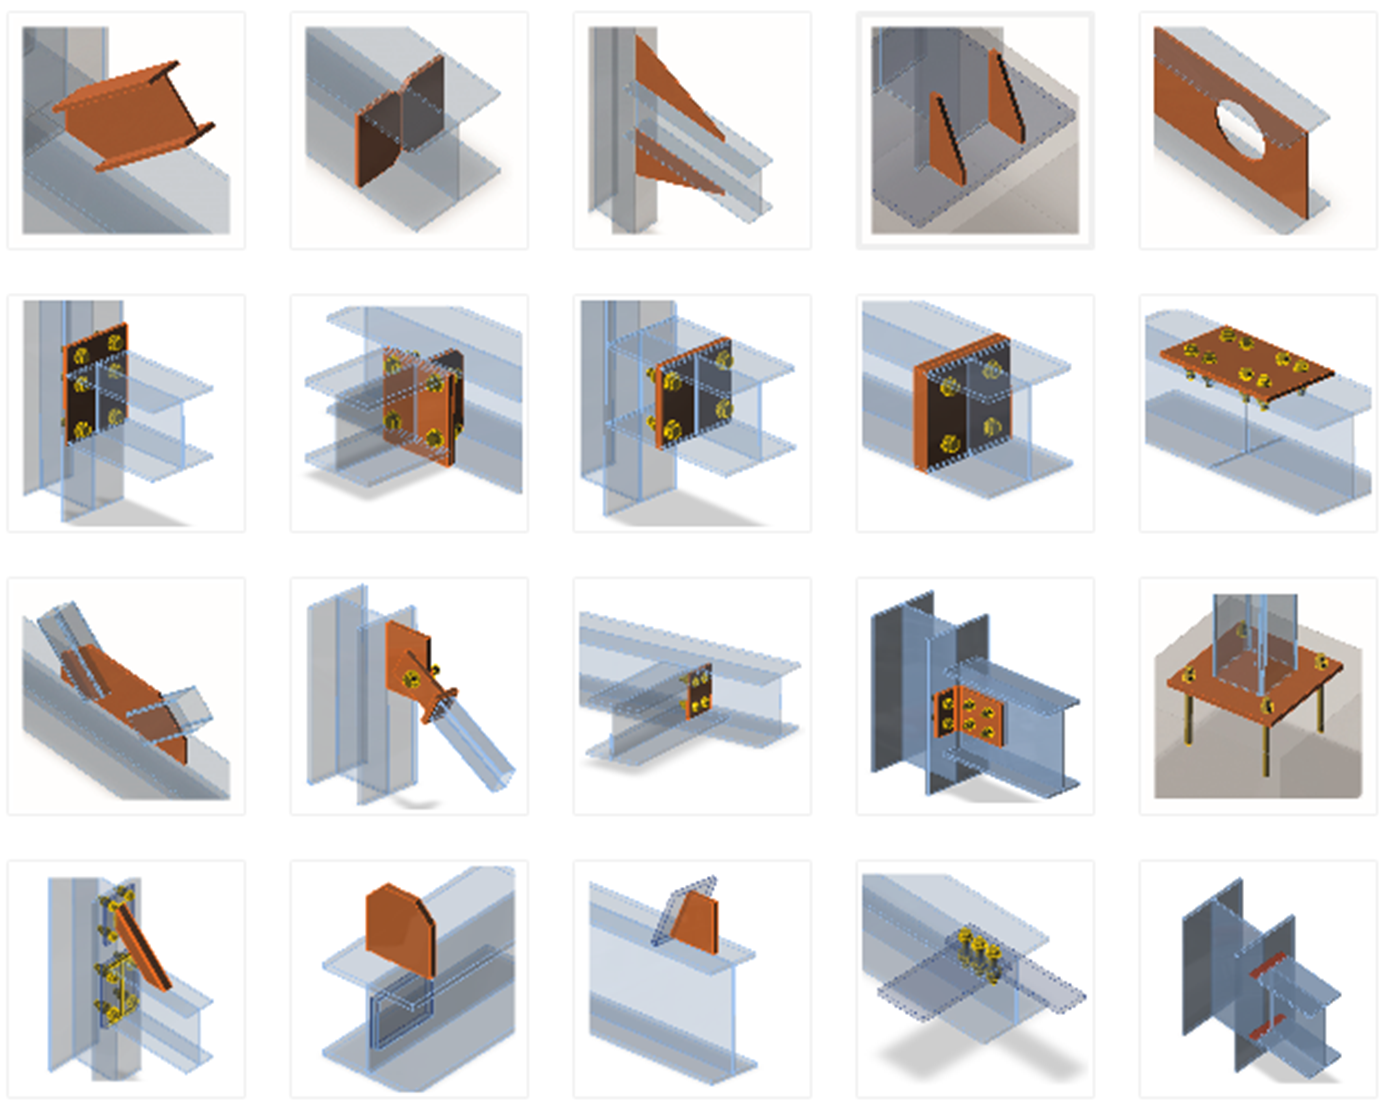
The analyzed FEM model is generated automatically. The designer does not create the FEM model, he creates the joint using manufacturing operations – see the figure.
Manufacturing operations/items which can be used to construct the joint
Each manufacturing operation adds new items to the connection – cuts, plates, bolts, welds.
Bearing members and supports
One member of the joint is always set as “bearing”. All other members are “connected”. The bearing member can be chosen by the designer. The bearing member can be “continuous” or “ended” in the joint. “Ended” members are supported on one end, and “continuous” members are supported on both ends.
Connected members can be of several types, according to the load which the member can take:
- Type N-Vy-Vz-Mx-My-Mz – member is able to transfer all 6 components of internal forces
- Type N-Vy-Mz – member is able to transfer only loading in XY plane – internal forces N, Vy, Mz
- Type N-Vz-My – member is able to transfer only loading in XZ plane – internal forces N, Vz, My
- Type N-Vy-Vz – member is able to transfer only normal force N and shear forces Vy and Vz
Plate to plate connection transfers all components of internal forces
Fin plate connection can transfer only loads in XZ plane – internal forces N, Vz, My
Gusset connection – connection of truss member can transfer only axial force N and shear forces Vy and Vz
Each joint is in the state of equilibrium during the analysis of the frame structure. If the end forces of the individual members are applied to detailed CBFEM model, the state of equilibrium is met too. Thus, it would not be necessary to define supports in the analysis model. However, for practical reasons, the support resisting all translations is defined in the first end of the bearing member. It does influence neither the state of stress nor the internal forces in the joint, only the presentation of deformations.
Appropriate support types respecting the type of the individual members are defined at the ends of the connected members to prevent the occurrence of unstable mechanisms.
The default length of each member is twice its height. The length of a member should be at least 1× the height of the member after the last manufacturing operation (weld, opening, stiffener etc.) due to the correct deformations after the rigid links connecting the cut end of a member to the connection node.
Node equilibrium in the 3D FEM model
The loads in any node in the structural model need to be in equilibrium. Any unbalanced forces are taken by supports. It is recommended to use a load combination instead of an internal forces envelope.
Each node of the 3D FEM model must be in equilibrium. The equilibrium requirement is correct, nevertheless, it is not necessary for the design of simple joints. One member of the joint is always „bearing, “ and the others are connected. If only the connection of connected members is checked, it is not necessary to keep the equilibrium. Thus, there are two modes of load input available:
- Simplified – for this mode, the bearing member is supported (continuous member on both sides), and the load is not defined on the member
- Advanced (exact with equilibrium check) – the bearing member is supported on one end, the loads are applied to all members, and the equilibrium has to be found
The mode can be switched in the ribbon group Loads in equilibrium.
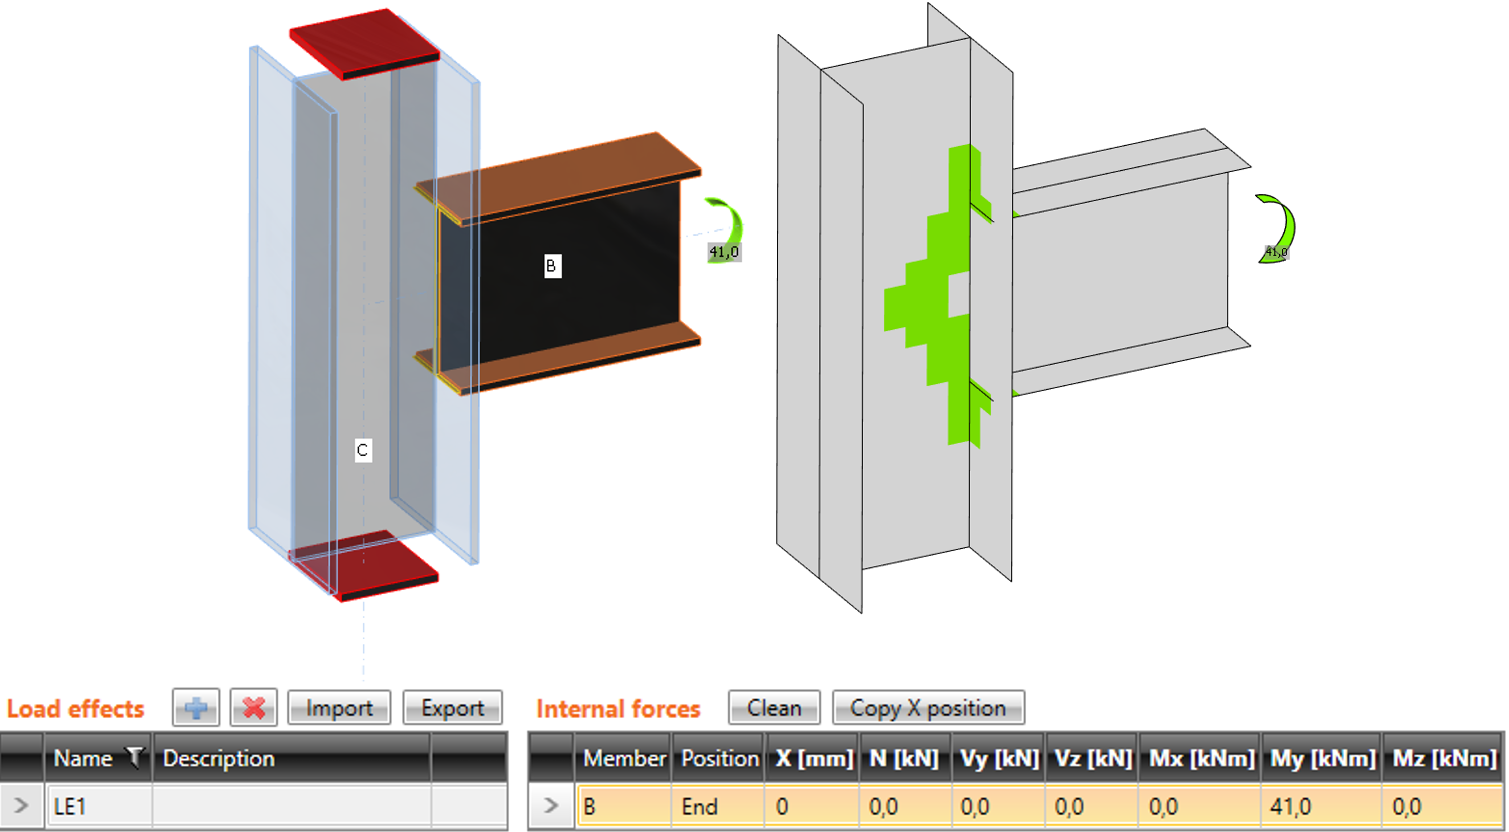
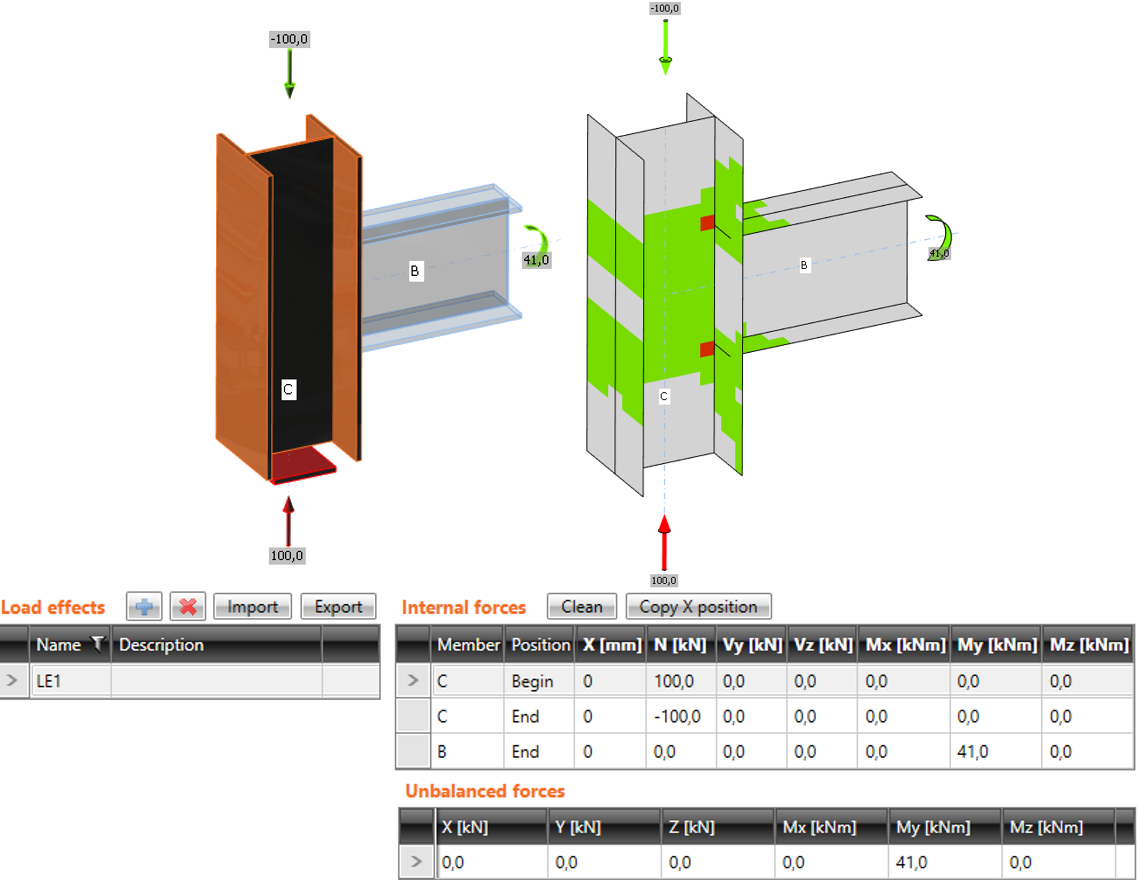
The difference between the modes is shown in the following example of T-connection. The beam is loaded by the end bending moment of 41 kNm. There is also a compressive normal force of 100 kN in the column. In the case of simplified mode, the normal force is not taken into account because the column is supported on both ends. The program shows only the effect of the bending moment of the beam. Effects of normal force are analyzed only in the full mode, and they are shown in the results.
Simplified input: normal force in the column is NOT taken into account
Advanced input: normal force in the column is taken into account
The simplified method is easier for the user, but it can be used only when the user is interested in studying connection items and not the behavior of the whole joint.
For cases where the bearing member is heavily loaded and close to its limit capacity, the advanced mode with respecting all the internal forces in the joint is necessary.
Internal forces in the steel connections
The end forces of a member of the frame analysis model are transferred to the ends of member segments. Eccentricities of the members caused by the joint design are respected during transfer.
The analysis model created by the CBFEM method corresponds to the real joint very precisely, whereas the analysis of internal forces is performed on a much idealized 3D FEM bar model, where individual beams are modeled using center lines, and the joints are modeled using immaterial nodes.
Joint of a vertical column and a horizontal beam
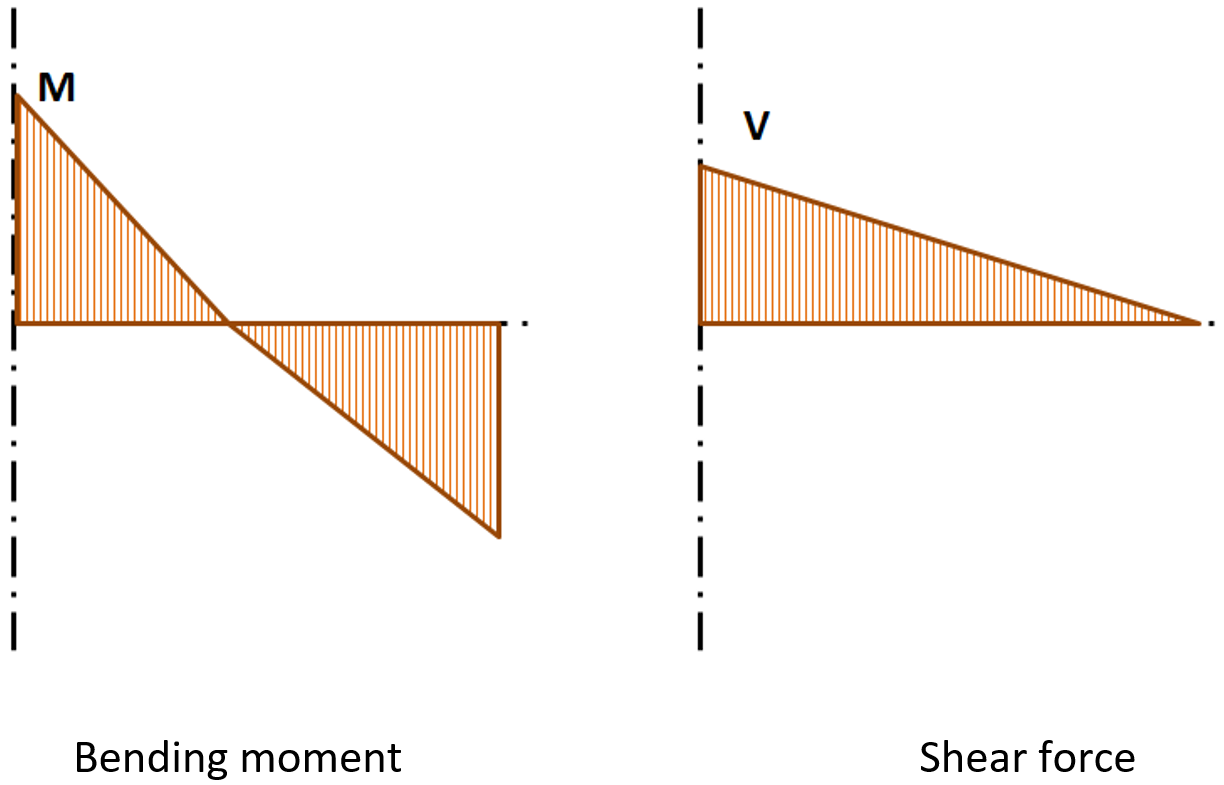
The internal forces are analyzed using 1D members in the 3D model. There is an example of the internal forces in the following figure.
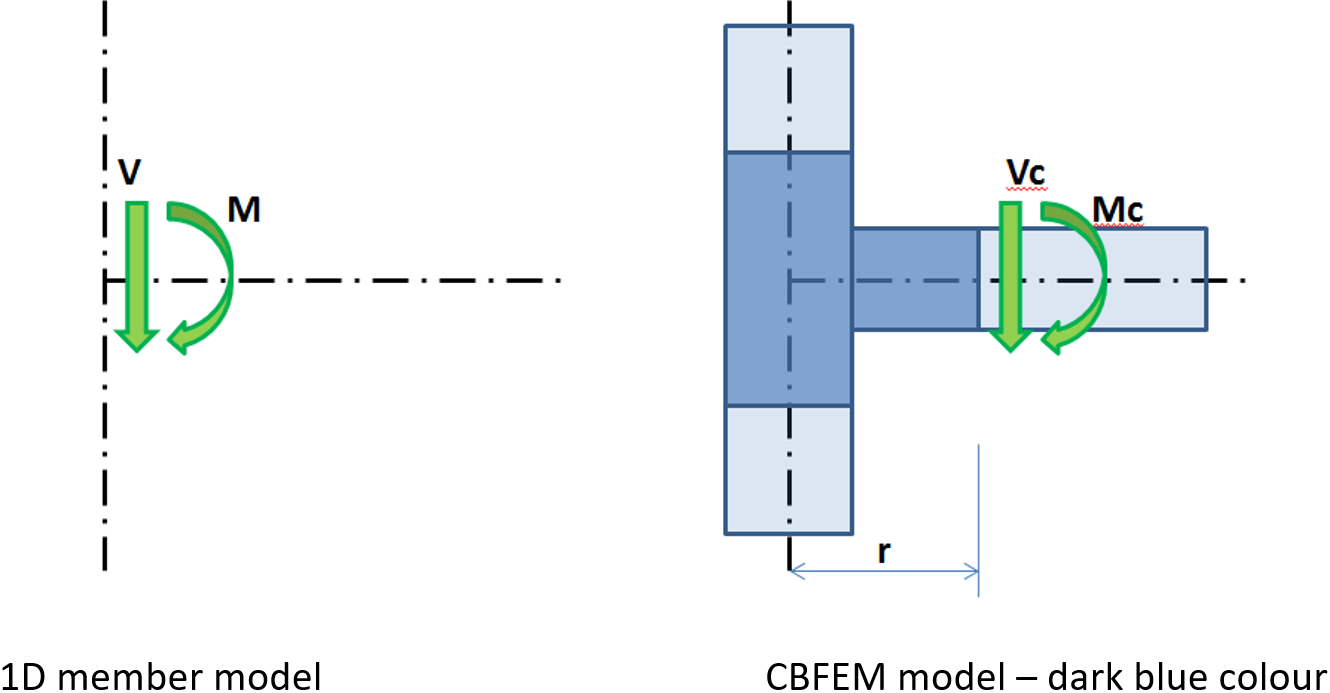
Internal forces in horizontal beam; M and V are the end forces at joint
The effects caused by a member on the joint are important to designing the joint (connection). The effects are illustrated in the following figure:
Effects of the member on the joint; CBFEM model is drawn in dark blue color
Moment M and shear force V act in the theoretical joint. The point of the theoretical joint does not exist in the CBFEM model, thus the load cannot be applied here. The model must be loaded by actions M and V, which have to be transferred to the end of the segment in the distance r
Mc = M – V ∙ r
Vc = V
In the CBFEM model, the end section of the segment is loaded by moment Mc and force Vc.
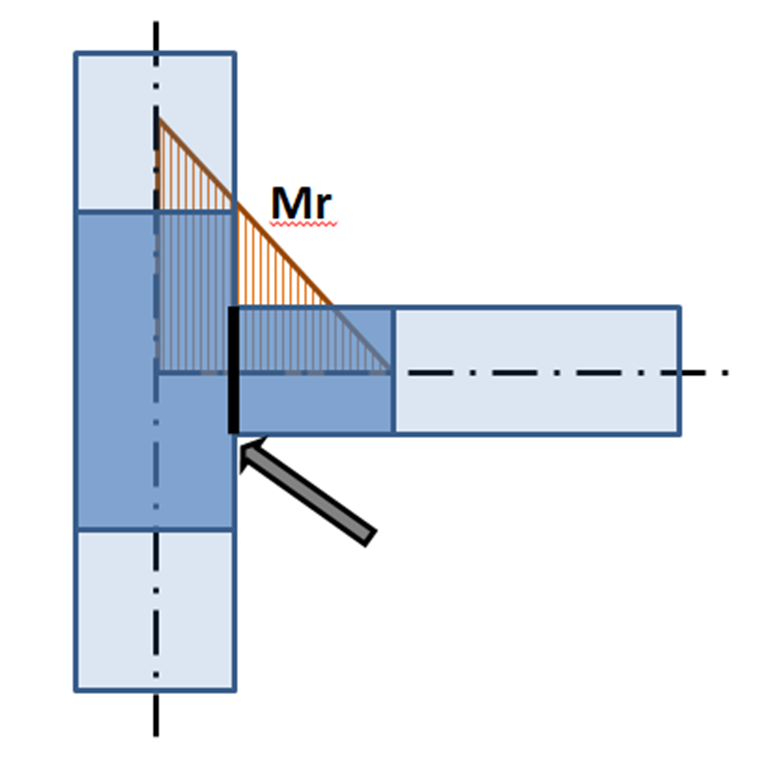
When designing the joint, its real position relative to the theoretical point of the joint must be determined and respected. The internal forces in the position of the real joint are mostly different from the internal forces in the theoretical point of joint. Thanks to the precise CBFEM model, the design is performed on reduced forces – see moment Mr in the following figure:
Bending moment on CBFEM model: The arrow points to the real position of the connection
When loading the joint, it must be respected that the solution of the real joint must correspond to the theoretical model used for the calculation of internal forces. This is fulfilled for rigid joints, but the situation may be completely different for hinges.
Position of hinge in theoretical 3D FEM model and in the real structure
It is illustrated in the previous figure that the position of the hinge in the theoretical 1D members model differs from the real position in the structure. The theoretical model does not correspond to reality. When applying the calculated internal forces, a significant bending moment is applied to the shifted joint, and the designed joint is overlarge or cannot be designed either. The solution is simple – both models must correspond. Either the hinge in 1D member model must be defined in the proper position, or the shear force must be shifted to get a zero moment in the position of the hinge.
Shifted distribution of bending moment on beam: zero moment is at the position of the hinge
The shift of the shear force can be defined in the table for the definition of the internal force.
The location of the load effect has a big influence on the correct design of the connection. To avoid all misunderstandings, we allow the user to select from three options – Node / Bolts / Position.
Note that when selecting the Node option, the forces are applied at the end of a selected member, which is usually at the theoretical node unless the offset of the selected member is set in geometry.
Import loads from FEA programs
IDEA StatiCa enables to import of internal forces from third-party FEA programs. FEA programs use an envelope of internal forces from combinations. IDEA StatiCa Connection is a program that resolves steel joint nonlinearly (elastic/plastic material model). Therefore, the envelope combinations cannot be used. IDEA StatiCa searches for extremes of internal forces (N, Vy, Vz, Mx, My, Mz) in all combinations at the ends of all members connected to the joint. For each such extreme value, also all other internal forces from that combination in all remaining members are used. Idea StatiCa determines the worst combination for each component (plate, weld, bolt etc.) in the connection.
The user can modify this list of load cases. He can work with combinations in the wizard (or BIM), or he can delete some cases directly in IDEA StatiCa Connection.
Warning!
It is necessary to take into account unbalanced internal forces during the import. This can happen in the following cases:
- Nodal force was applied to the position of the investigated node. The software cannot detect which member should transfer this nodal force and, therefore, it is not taken into account in the analysis model. Solution: Do not use nodal forces in global analysis. If necessary, the force must be manually added to a selected member as a normal or shear force.
- Loaded, non-steel (usually timber or concrete) member is connected to the investigated node. Such member is not considered in the analysis, and their internal forces are ignored in the analysis. Solution: Replace the concrete member with a concrete block and anchorage.
- The node is a part of a slab or a wall (usually from concrete). The slab or the wall is not part of the model, and its internal forces are ignored. Solution: Replace the concrete slab or wall with a concrete block and anchorage.
- Some members are connected to the investigated node via rigid links. Such members are not included in the model, and their internal forces are ignored. Solution: Add these members into the list of connected members manually.
- Seismic load cases are analyzed in the software. Most FEA software offer the modal analysis to solve seismicity. The results of internal forces of seismic load cases provide usually only internal force envelopes in sections. Due to the evaluation method (square root of the sum of squares – SRSS), the internal forces are all positive and it is not possible to find the forces matching to the selected extreme. It is not possible to achieve a balance of internal forces. Solution: Change the positive sign of some internal forces manually.
Strength analysis of steel joints
Strength analysis is the most important analysis of joints. Strain checks of plates together with code checks of components are performed by elastic-plastic analysis.
The analysis of joints is materially non-linear. The load increments are applied gradually, and the state of stress is searched. There are two optional analysis modes in IDEA StatiCa Connection:
- The response of structure (joint) to the overall load. All defined load (100 %) is applied in this mode, and the corresponding state of stress and deformation is calculated.
- Analysis termination at reaching the ultimate limit state. The checkbox in Code setup “Stop at limit strain” should be ticked. The state is found when the plastic strain reaches the defined limit. In the case when the defined load is higher than the calculated capacity, the analysis is marked as non-satisfying, and the percentage of used load is printed. Note that the analytical resistance of components, for example of bolts, can be exceeded.
The second mode is more suitable for practical design. The first one is preferable for a detailed analysis of complex joints.
Stiffness analysis and deformation capacity of steel joints
Joints are classified according to stiffness as rigid, semirigid, and pinned. The engineer should ensure that the stiffness of the joint confirms the stiffness set in the CAE software. The goal of the stiffness analysis is to get the correct load distribution in members and joints, and correct deflections of the members and overall structure
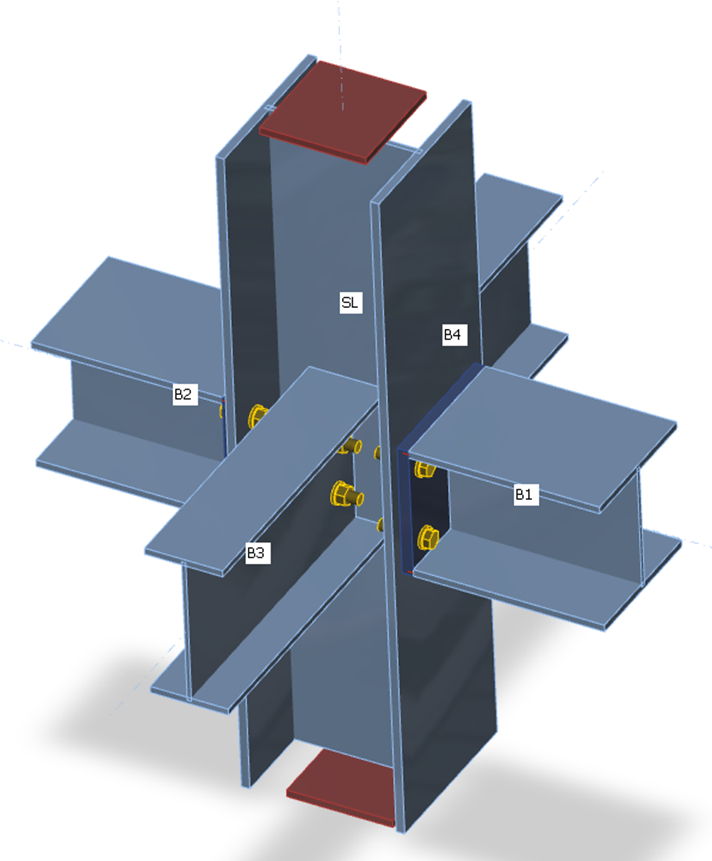
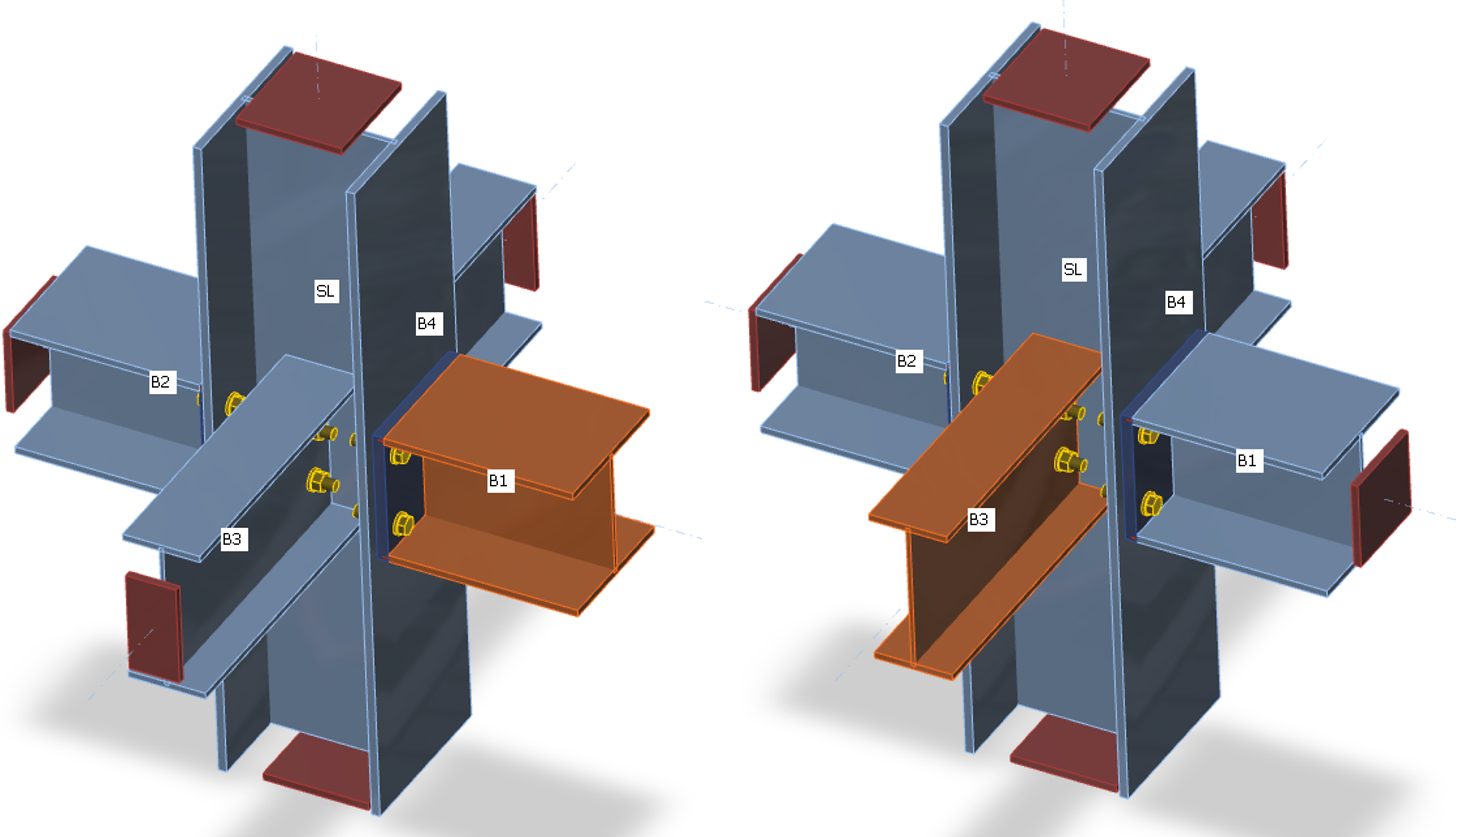
The CBFEM method analyzes the stiffness of the connection of individual joint members. For the proper stiffness analysis, a separate analysis model must be created for each analyzed member. Then, the stiffness analysis is not influenced by the stiffness of other members of joint but only by the node itself and the construction of the connection of the analyzed member. Whereas the bearing member is supported for the strength analysis (member SL in the figure below), all members except the analyzed one are supported by the stiffness analysis (see two figures below for stiffness analysis of members B1 and B3). The exception is the column base where supports are provided by the concrete foundation, only the analyzed member is loaded, and other members have restrains only according to their model type.
Supports on members for strength analysis
| Supports on members for stiffness analysis of member B1 | Supports on members for stiffness analysis of member B3 |
Loads can be applied only to the analyzed member. If bending moment, My, is defined, the rotational stiffness about the y-axis is analyzed. If bending moment Mz is defined, the rotational stiffness about the z-axis is analyzed. If axial force N is defined, the axial stiffness of the connection is analyzed.
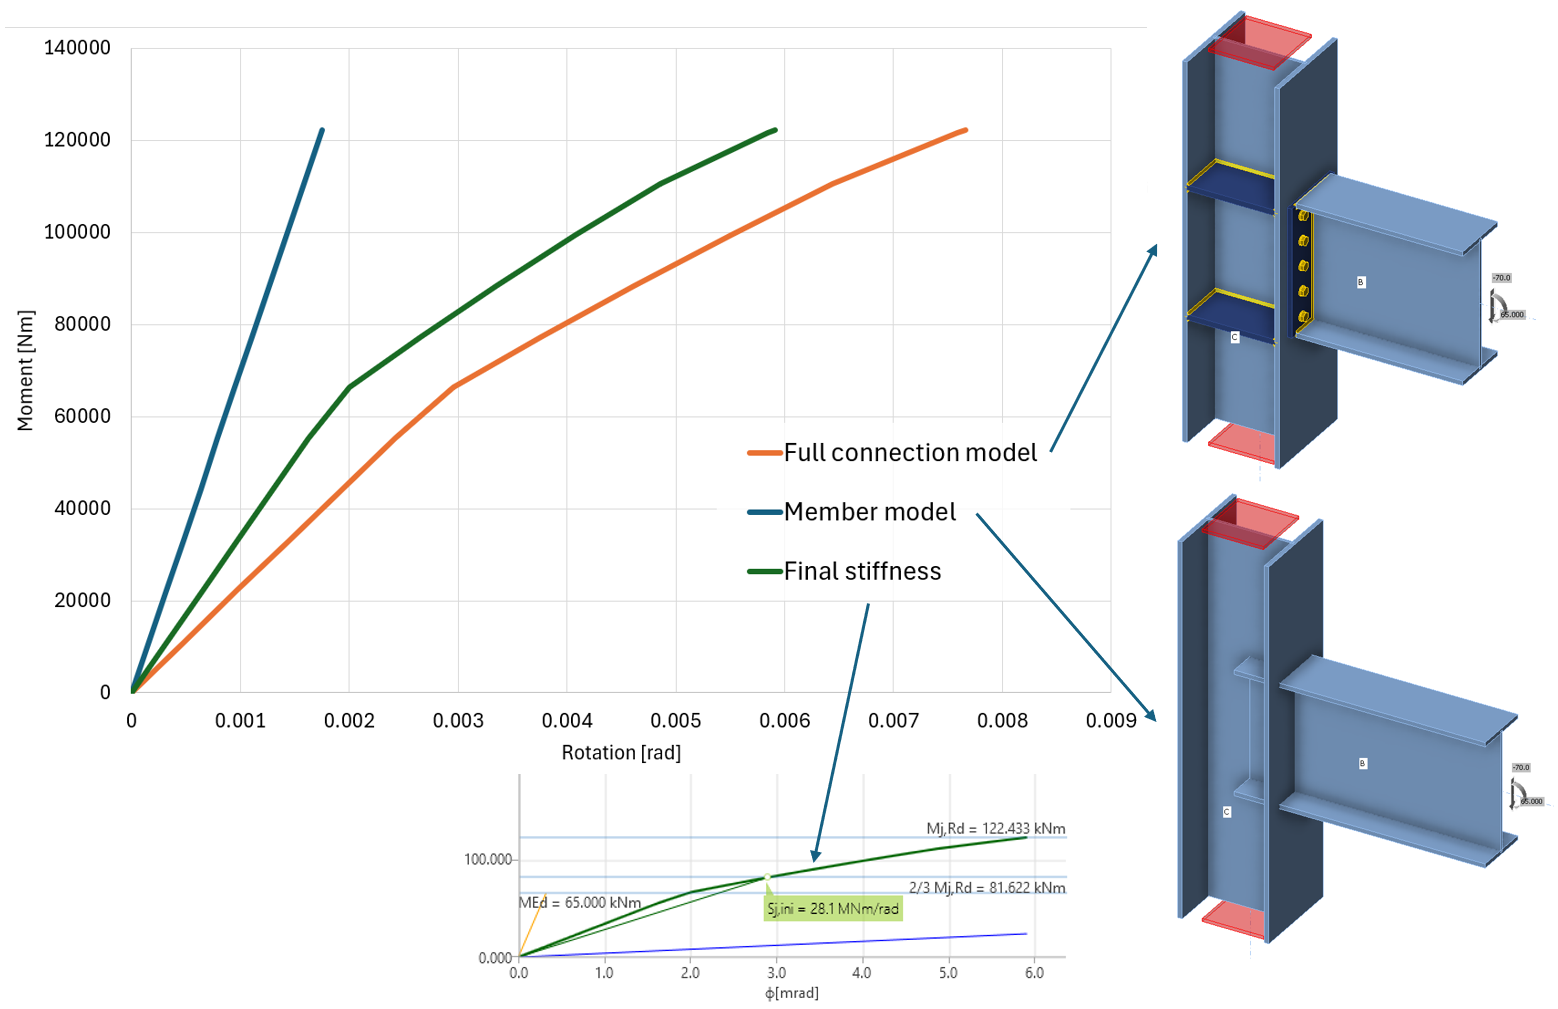
The moment-rotation (or load-deformation) curve is calculated for two models:
- Full connection model – with members, plates, bolts, welds, etc. (materially nonlinear analysis)
- Member model – with members only rigidly connected in the node (linear elastic analysis)
The shown diagram is created by subtracting the Member model from the Full connection model. This way, the elastic deformation of members, which is already included in the model of the overall structure, is excluded.
The program generates a complete diagram automatically; it is directly displayed in the GUI and can be added to the output report. Rotational or axial stiffness can be studied for specific design loads. IDEA StatiCa Connection can also deal with the interaction of the other internal forces.
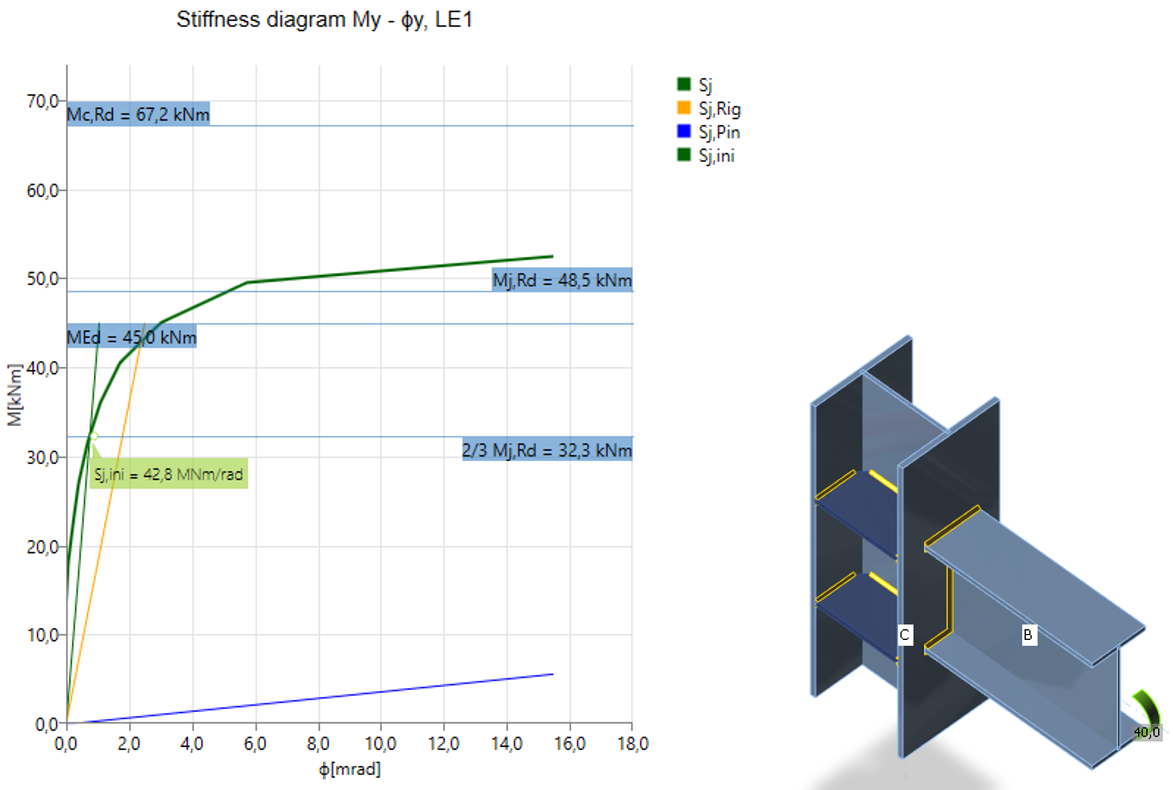
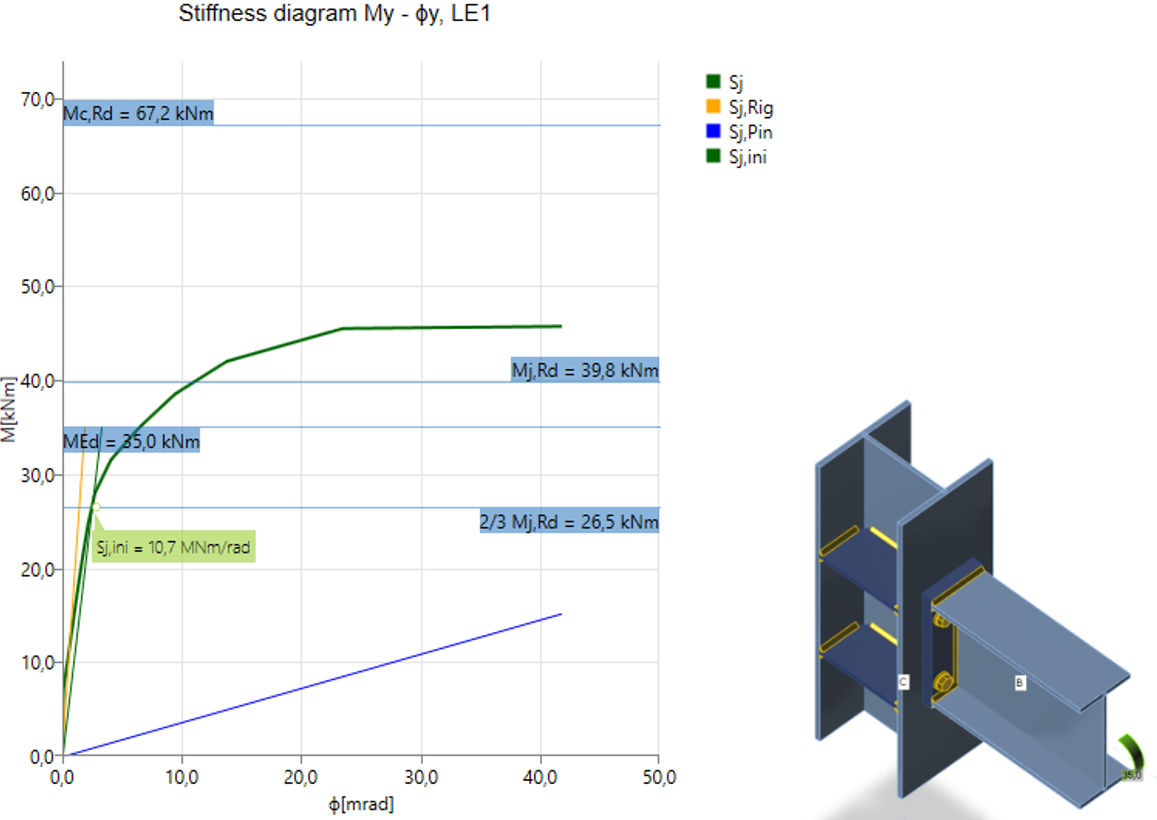
Diagram shows:
- Level of design load MEd
- Limit value of capacity of connection for 5% equivalent strain Mj,Rd; limit for plastic strain may be changed in Code setup
- The limit value of capacity of connected member (useful also for seismic design) Mc,Rd
- 2/3 of limit capacity for calculation of initial stiffness
- Value of initial stiffness Sj,ini
- Value of secant stiffness Sjs
- Limits for the classification of connection – rigid and pinned
- Rotational deformation Φ
- Rotational capacity Φc
Rigid welded connection
Semi-rigid bolted connection
After reaching the 5 % strain in the column web panel in shear, the plastic zones propagate rapidly
The joint is classified according to its stiffness into rigid, semi-rigid, or pinned category according to the relevant code. The theoretical length of the member can be set for the analyzed member:
How are the loads applied?
Only one member is loaded and investigated in the stiffness analysis. The analyzed member may be loaded by:
- Normal force N
- Shear forces Vy and Vz
- Bending moments My and Mz
- Torsion Mx
All load effects are applied simultaneously. If the applied loads are too small, they are all increased by a factor so that the joint resistance is reached (applied forces must be greater than 1). When creating the moment-rotation or load-deformation diagrams, all the load effects are increased in steps proportionally.
For example, the analyzed member is loaded by:
- Normal force N = 50 kN
- Shear force Vz = -80 kN
- Bending moment My = 30 kNm
The member resistances are:
- Normal resistance NR = 2 111 kN
- Shear resistance Vz,R = 763 kN
- Bending moment resistance My,R = 226 kNm
The loads are multiplied by a factor:
\[ \alpha = \textrm{min} \left \{ \frac{N_R}{N}, \, \frac{M_{y,R}}{M_y}, \, \frac{M_{z,R}}{M_z} \right \} \]
Note that if the shear force is not applied in the node, i.e. it acts on a lever arm, the bending moment is affected. The bending moment in the node, as seen in a wireframe model, is used as a set load.
In this example, the factor is \( \alpha = 7.53 \). Set loads are multiplied and then applied in steps, and the results are plotted in the Stiffness diagram. The applied loads are divided into 12 steps, and when the connection is nearing its resistance, the steps are further refined. The example of the first three steps is in the following table:
| Set loads | Applied loads | First step | Second step | Third step | |
| 100% | 8.33% | 16.67% | 25.00% | ||
| N | 50 | 377 | 31 | 63 | 94 |
| Vy | 0 | 0 | 0 | 0 | 0 |
| Vz | -80 | -603 | -50 | -100 | -151 |
| Mx | 0 | 0 | 0 | 0 | 0 |
| My | 30 | 226 | 19 | 38 | 57 |
| Mz | 0 | 0 | 0 | 0 | 0 |
Deformation capacity
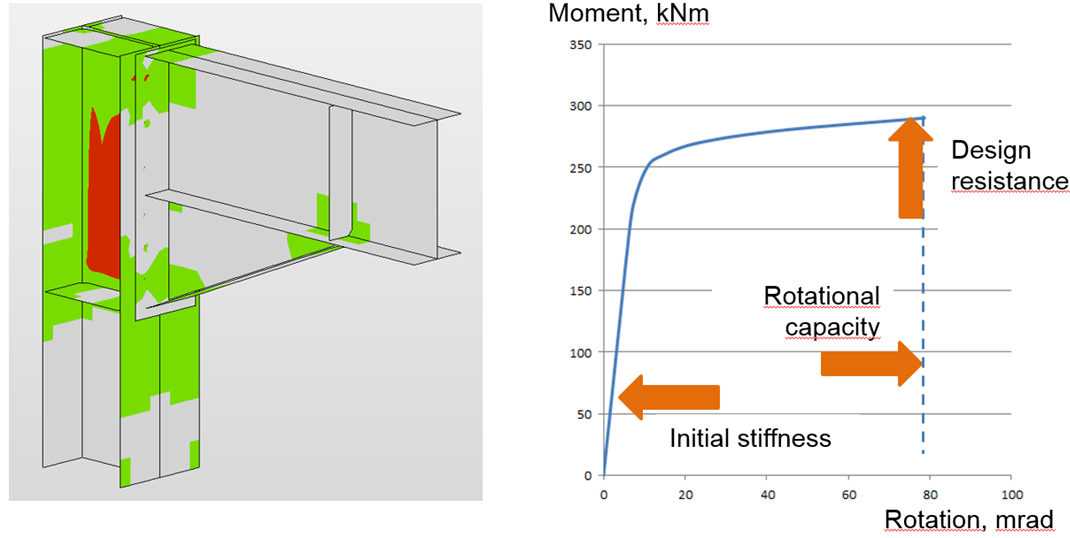
The deformation capacity/ductility δCd belongs with the resistance and the stiffness to the three basic parameters describing the behavior of connections. In moment-resistant connections, the ductility is achieved by a sufficient rotation capacity φCd. The deformation/rotation capacity is calculated for each connection in the joint separately.
The software estimates the deformation capacity as a point where one of the following conditions is achieved:
- Bolt or anchor resistance in tension, shear, or tension/shear interaction is reached
- Weld resistance is reached
- Plastic strain in plates is 15 %
The estimation of the rotation capacity is important in connections exposed to seismic, see Gioncu and Mazzolani (2002) and Grecea (2004) and extreme loading, see Sherbourne and Bahaari (1994 and 1996). The deformation capacity of components has been studied from the end of the last century (Foley and Vinnakota, 1995). Faella et al. (2000) carried out tests on T-stubs and derived the analytical expressions for the deformation capacity. Kuhlmann and Kuhnemund (2000) performed tests on the column web subjected to transverse compression at different levels of compression axial force in the column. Da Silva et al. (2002) predicted deformation capacity at different levels of axial force in the connected beam. Based on the test results combined with FE analysis, deformation capacities are established for the basic components by analytical models by Beg et al. (2004). In the work, components are represented by non-linear springs and appropriately combined in order to determine the rotation capacity of the joint for the end-plate connections, with an extended or flush end-plate and welded connections. For these connections, the most important components that may significantly contribute to the rotation capacity were recognized as the web in compression, column web in tension, column web in shear, column flange in bending, and end-plate in bending. Components related to the column web are relevant only when there are no stiffeners in the column that resist compression, tension, or shear forces. The presence of a stiffener eliminates the corresponding component, and its contribution to the rotation capacity of the joint can be therefore neglected. End-plates and column flanges are important only for end-plate connections where the components act as a T-stub, where also the deformation capacity of the bolts in tension is included. The questions and limits of the deformation capacity of connections of high-strength steel were studied by Girao et al. (2004).
Steel connection capacity design
Capacity design is a part of a joint check-in seismic design. When relying on the ductility of a structure, the capacity design must be performed.
The objective of capacity design is to confirm a building undergoes controlled ductile behavior to avoid a collapse in a design-level earthquake.
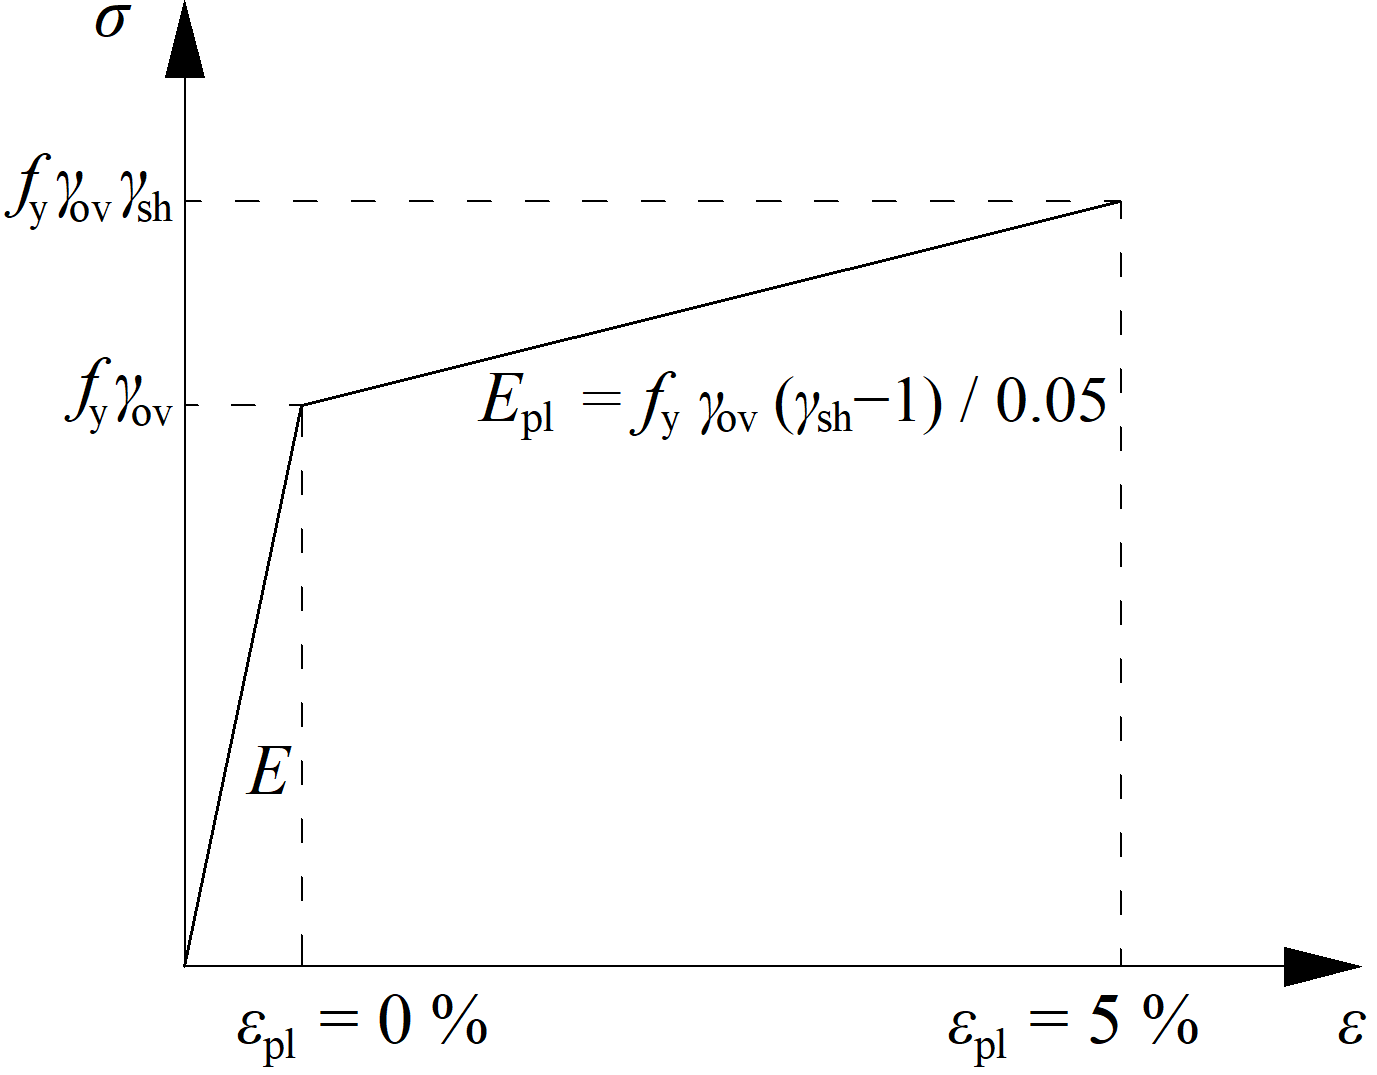
A dissipative item is selected with increased strength and a modified material diagram. An overstrength factor \(\gamma_{ov}\) is defined in Materials, and a strain-hardening factor \(\gamma_{sh}\) at the dissipative item operation. Note that the nomenclature differs between the codes. A dissipative item is excluded from the strain check of plates.
Modified material diagram for dissipative item
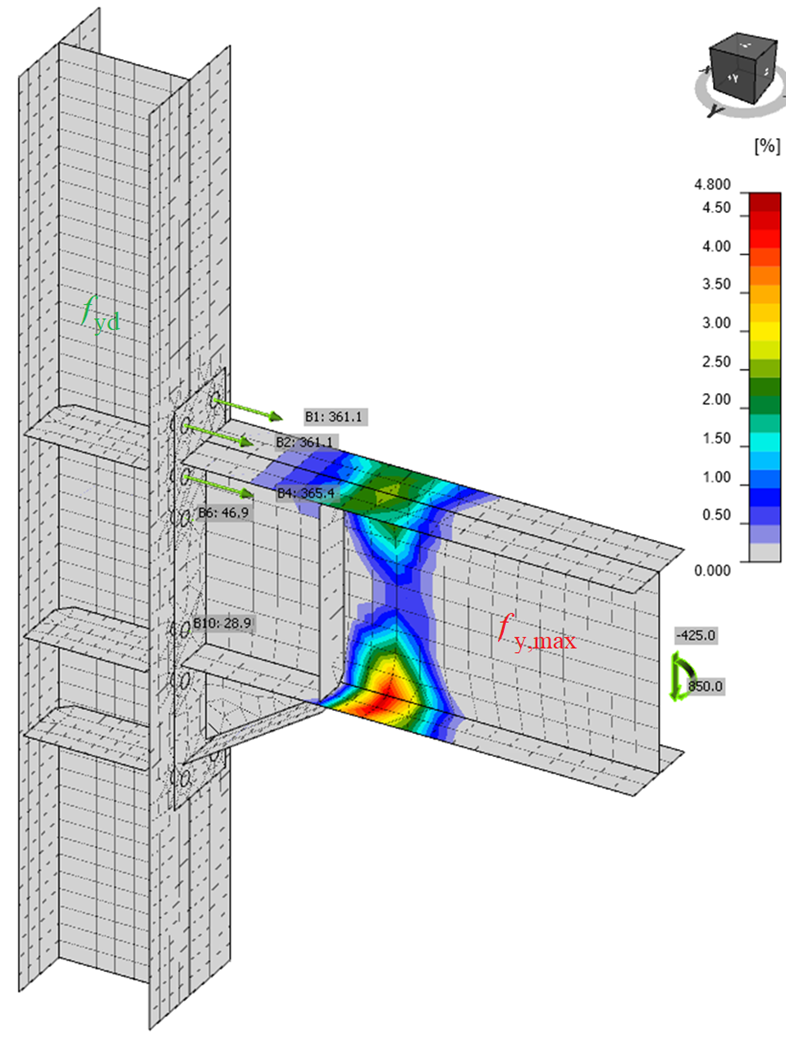
IDEA StatiCa Connection checks the connection on applied design load, which should create a plastic hinge in the selected dissipative item, usually the beam. The plastic strain in the dissipative item should be around 5%. This can serve as a confirmation that the magnitude and position of loads were determined properly.
Plastic hinge created at the intended place of the dissipative item – the beam
The supports of the continuous member are automatically defined as supported at one end and with restrained moments at the other end. This way, the continuous column may be loaded by the normal force and shear forces, and also one side may move sideways so that the failure of the column web in shear is revealed.
Note, that detailing is very important for seismic resistant joints but is not checked in IDEA StatiCa.
Joint design resistance
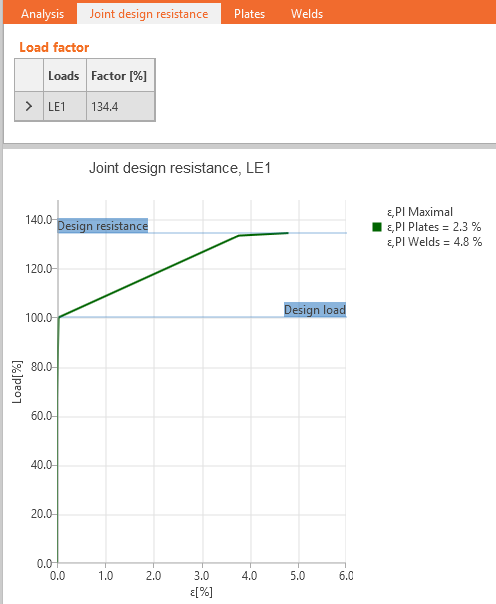
The designer usually solves the task of designing the connection/joint to transfer the known design load. But it is also useful to know how far the design from the limit state is, i.e., how big the reserve in the design is and how safe it is. This can be done simply by the type of analysis – Joint design resistance.
The user inputs design load like in a standard design. The software automatically proportionally increases all load components until one of the included checks does not satisfy.
DR analyses conduct checks for the following components:
- Plastic strain in plates
- Bolts – shear, tension, and a combination of tension and shear
- Anchors – tension and shear steel resistance
- Welds
Please note that other components not included in the above list will not be checked due to unknown directions of forces in components. For this reason, an EPS analysis should always be conducted to ensure that all checks are correctly performed.
The user gets the ratio of maximal load to the design load. Also, a simple diagram is provided.
The results of user-defined load cases are shown unless the Joint design resistance Factor is smaller than 100 % which means that the calculation did not converge, and the last converged step of the load case is shown.
Steel joint buckling analysis
Buckling is usually not an important issue in joints. However, it should be checked that there are no buckling issues and that the results of strength analysis, which uses only geometrically linear analysis, are correct.
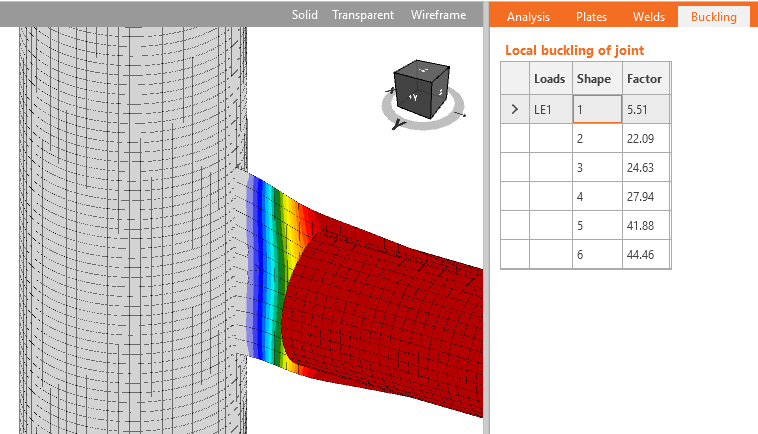
IDEA StatiCa Connection can perform linear buckling analysis of a model of a joint. The results are predicted in buckling modes. Critical load, at which buckling of the perfect model occurs, is calculated for each buckling mode. Critical load is presented by multipliers of the load acting on the joint. According to the buckling mode and critical load multiplier, the user can determine the safe buckling design.
Some codes, e.g. Eurocode (EN 1993-1-1, Chapter 5.2.1), recommend a critical load multiplier higher than 15 for bar models of structures. If the critical load multiplier is higher than 15, the code does not require a buckling check of members.
For joints, the matter is different, and the code does not provide any specific recommendation. The design of local buckling must be tackled in another way. Generally, the local buckling may be divided into three groups:
- Plates connecting individual members
- Stiffening plates in the joint – stiffeners, ribs, short haunches
- Closed sections and thin-walled sections
The buckling of plates from group 1 affects the buckling shape of the whole member. Therefore, it is recommended to apply the same rules as for these members also to these plates, i.e., consider safe critical load multiplier 15 and higher. The engineer should verify that the real execution of the joint corresponds to the boundary conditions of the model used for buckling analysis of the whole structure.
Plates from group 2 affect the local buckling of the joint. For such plates, the safe boundary of critical load multiplier 15 is conservative, but specific guidance is missing in codes. The guidance is provided by research papers that recommend a safe boundary of critical load multiplier equal to 3.
Buckling of plates and members from group 3 is very problematic, and individual assessment of each particular case is necessary.
For plates with a critical load multiplier smaller than suggested values (15 for group 1, 3 for group 2), plastic design cannot be used. Other methods that are not offered by IDEA StatiCa are necessary for their check.
The result of buckling analysis in IDEA StatiCa Connection is not a definite check. The codes do not give sufficient guidance. The assessment requires engineering judgment and IDEA StatiCa provides unique tools not available in standard design software.
Gusset plate as an elongation of a truss – example of the plate from group 1 for which buckling can be neglected if the critical buckling factor is higher than 15
Examples of buckling shapes of plates from group 2 where the buckling can be neglected if the critical buckling factor is higher than 3
The model used for buckling analysis is supported by different supports than set by the user in stress, strain analysis type (EPS). The bearing member stays fully supported. Model type of a beam set as N-Vy-Vz-Mx-My-Mz (free to move in stress, strain analysis type) is fully supported in buckling analysis. All other beam analysis types have restrained bending moments and normal force but are free to move sideways.
- Model type N-Vy-Vz-Mx-My-Mz: supports in buckling model: N-Vy-Vz-Mx-My-Mz
- Model type N-Vy-Vz: supports in buckling model: N-Mx-My-Mz
- Model type N-Vz-My: supports in buckling model: N-Mx-My-Mz
- Model type N-Vy-Mz: supports in buckling model: N-Mx-My-Mz
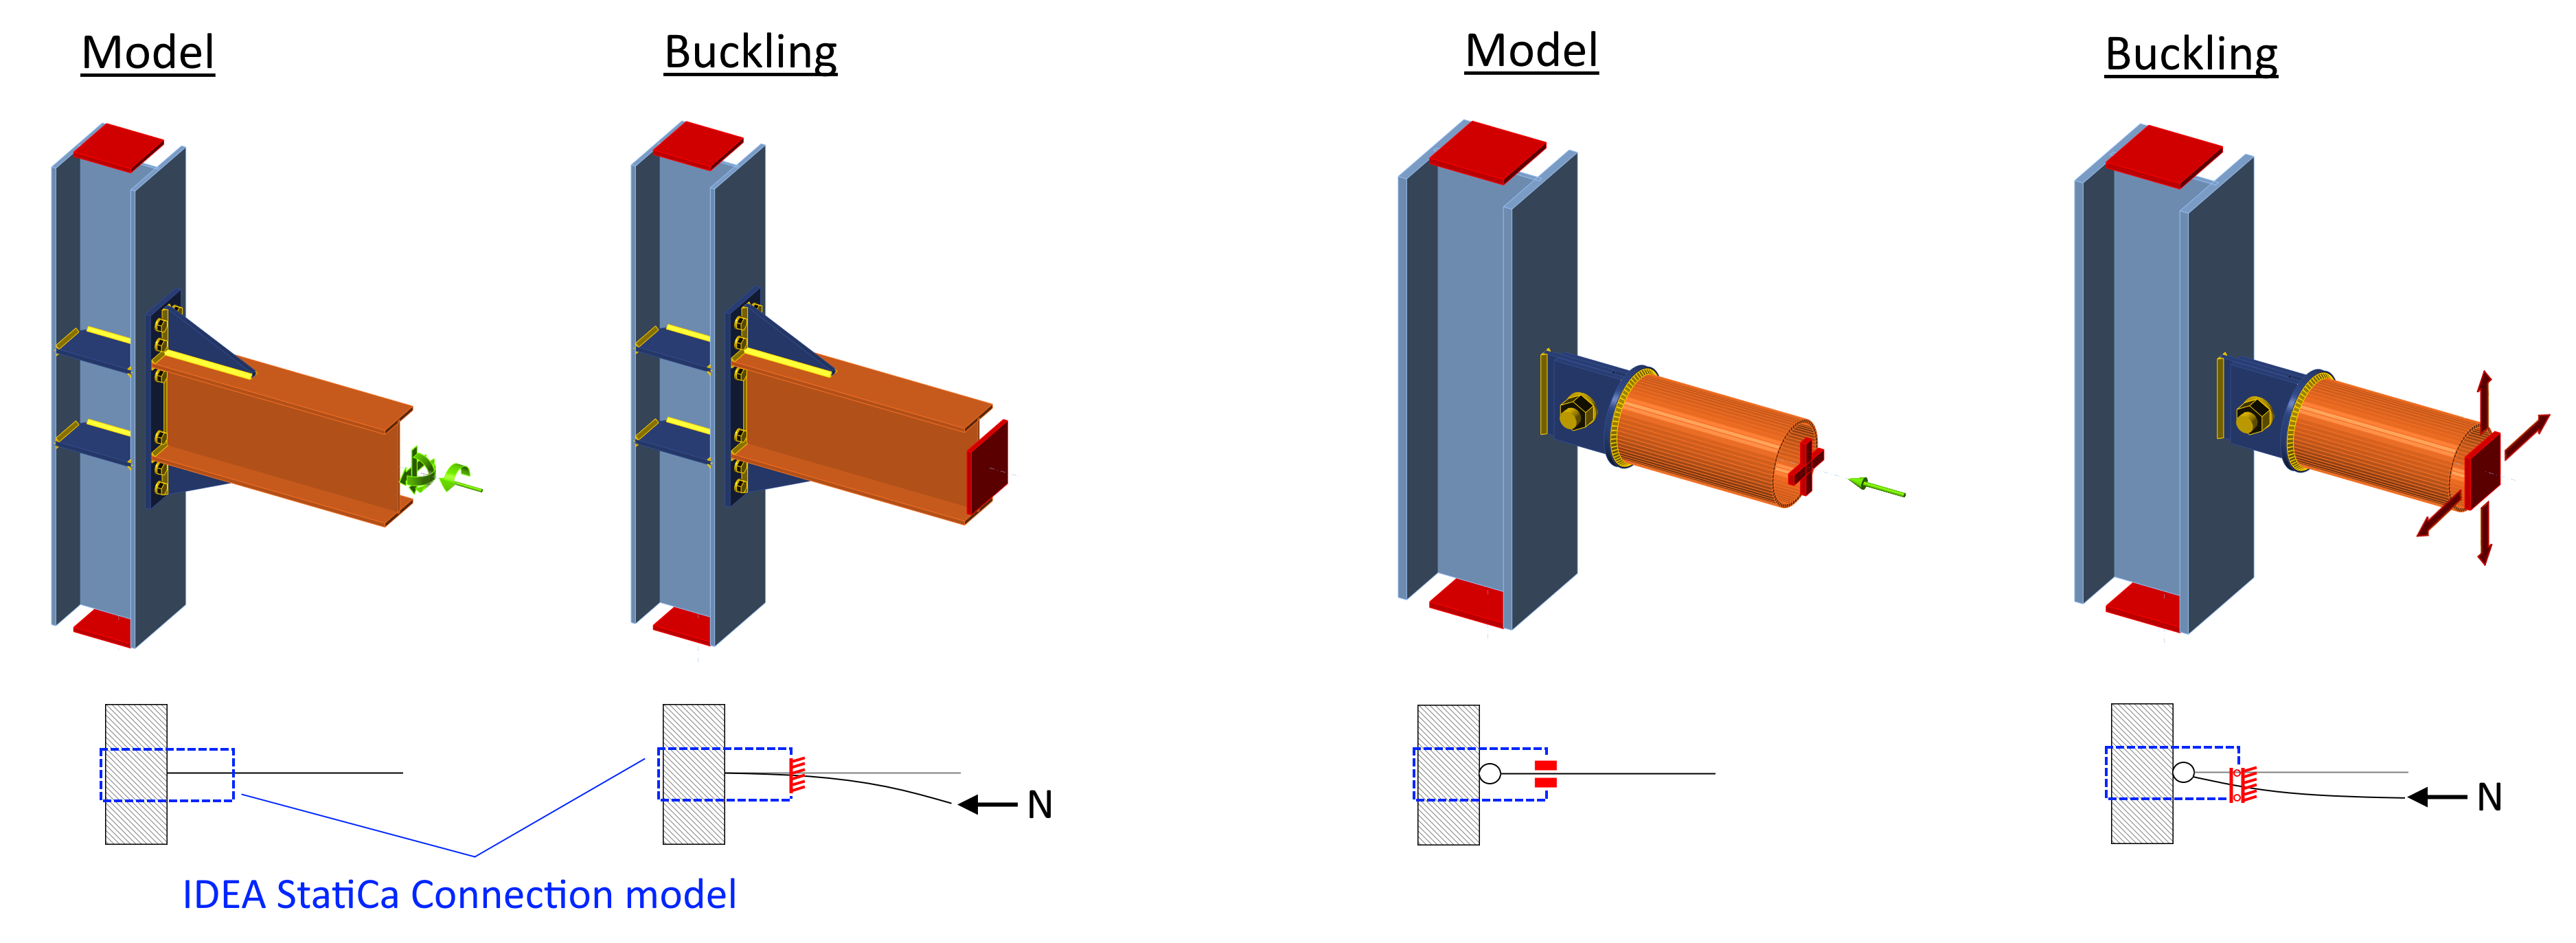
It is assumed that in case of rigid joint, user sets the bending moment and the buckling of the short beam segment is not relevant. On the other hand, in the case of the pinned joint, user sets only normal and shear force and no bending moment, but the buckling of the pinned member is relevant, so it contributes to the buckling factor. See the figure below. "Model" shows the model in the stress-strain analysis type, and "Buckling" shows the model in the buckling analysis.
Analysis convergence of complex steel connection models
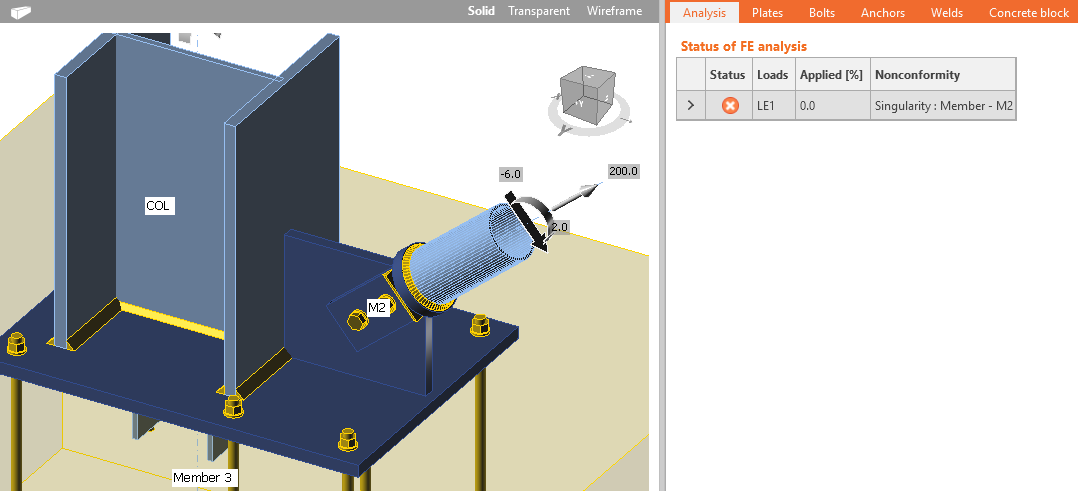
The finite element analysis might not converge for several reasons, usually due to some element that is not sufficiently supported and can freely move or rotate.
Finite element analysis requires a slightly increasing stress-strain diagram of material models. In some cases of complicated models, e.g., with multiple contacts, the increase in divergent iterations might help with convergence. This value can be set in the Code setup. The most common causes of analysis failure are singularities when the parts of a model are not connected properly and are free to move or rotate. A user is notified and should check the model for missing welds or bolts. The deformed shape is shown with the items which caused the first singularity moved 1 m so that singularity may be easily detected.
Missing welds at gusset plates leading to singularity
Steel-to-timber joints (Theoretical Background)
Steel-to-timber joints are there at the moment only for the check of steel plates and determination of force vectors in fasteners. Gusset plates can be applied as either enclosed or inserted.
The material properties of timber are not specified. The checks of fasteners and the timber should be performed manually or in another software according to appropriate design rules. Therefore, stiffness analysis is not available.
The check of any other components of steel connections are code checked as usual.
Read more about how to work with steel-to-timber joints in the Knowledge base article.
Thin-walled steel members
IDEA StatiCa Connection for design of joints of thin-walled members should be left only to experienced engineers. Buckling analysis is a must and each mode shape must be carefully analyzed.
Software IDEA StatiCa Connection is dedicated to the assessment of connections of hot-rolled members which are not significantly affected by buckling. The geometrically linear and materially non-linear analysis is performed because of its fast and stable calculation. However, this analysis is not sufficient for stability loss. If buckling may be a problem, performing a linear buckling analysis helps to detect dangerous areas and provide a factor for Euler’s bifurcation point, but this is still not enough for thin-walled members. For thin-walled members, only geometrically nonlinear analysis with imperfections is suitable.
If the user still decides to use IDEA StatiCa Connection software to check connections of thin-walled members, he should:
- Perform linear buckling analysis and carefully evaluate each buckling shape, the first 5 presented buckling shapes might not be enough (How to increase the number of evaluated shapes)
- Do not rely on the plasticity of steel plates and rather limit the von Mises stress to yield strength or even lower
- Be aware that local buckling, which is not considered, can redistribute internal forces in components differently
- Be aware that the stiffness of components may be different due to different failure modes or their combination.
- Be aware that presented checks and detailing of components (e.g., bolts, welds) are the following guides for standard members. The checks for thin-walled members may vary, and then the provided checks are not correct.
The design of connections of thin-walled members is very case-specific, and no general guide can be provided. IDEA StatiCa Connection was not validated for this use.
Component checks – EN
In EN 1993-1-1 thin-walled members are defined as: “Class 4 cross-sections are those in which local buckling will occur before the attainment of yield stress in one or more parts of the cross-section.” The main part of Eurocode for steel is limited to members with material thickness t ≥ 3 mm. Chapter 4 – Welded connections apply only to a material thickness of t ≥ 4 mm. Therefore, the checks of components provided by software do not apply to cold-formed members with smaller thicknesses. Users should be aware of this and replace the checks with appropriate formulas from EN 1993-1-3 manually.
Analysis of hollow section joints should also be carefully performed for members which are out of the range of validity for welded joints – EN 1993-1-8 – Table 7.1. There are no guidelines for such joints, and the software results have not been validated.
Component checks – AISC
In Chapter A of AISC 360-16 there is a user note stating: “For the design of cold-formed steel structural members, the provisions in the AISI North American Specification for the Design of Cold-Formed Steel Structural Members (AISI S100) are recommended, except for cold-formed hollow structural sections (HSS), which are designed in accordance with this Specification.” AISI S100 and AS/NZS 4600 provide formulas to determine the shear and tension resistance of the most common fastener types together with their range of application
Component checks – CISC
CSA S16-14 states in Chapter 1: “Requirements for steel structures such as bridges, antenna towers, offshore structures, and cold-formed steel structural members are given in other CSA Group Standards.”
Lateral-torsional restraint in structural design
Model description
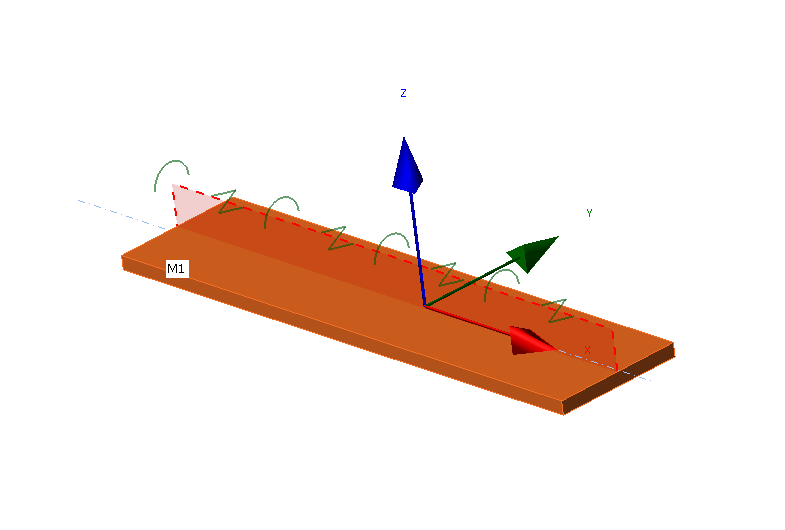
Lateral-torsional restraint is simulated by two stiffnesses added to any plate:
- Lateral (shear) S [N] applied in the direction of y axis of plate local coordinate system
- Torsional C [Nm/m] applied around x axis of a plate local coordinate system
Users may select any plate of a member, length of the restraint, type (continuous or discrete with set spacing), and lateral and torsional stiffnesses.
Local coordinate system of a plate with applied LTR
Nodes of finite elements are connected along the plate width by rigid body elements type 3 (RBE3) to one point at the plate longitudinal axis. Torsional stiffness is applied at this point by a special element with only one stiffness, rotation around x axis. This point is also connected by two other RBE3 with a special element between them with one stiffness, displacement in y axis.
The lateral stiffness is set by the user as free, rigid, or with set stiffness. Rigid stiffness is sufficiently high, set as 1000 times the shear stiffness of the plate. Stiffness \(S\) is set per unit length (one meter) with a force unit [N]. The stiffness of one element \(S_i\) has a force unit divided by length unit [N/m] and is then:
\[ S_i = \frac{S}{s_d} \]
where:
- \(s_d\) – distance between two points [m]
For discrete type, spacing is set directly by the user. For continuous type, the spacing is sufficiently small so that the behavior of the plate is not affected by spacing.
Similarly, the torsional stiffness is set by the user as free, rigid, or with set stiffness. Rigid stiffness is sufficiently high, set as 1 000 times the bending stiffness of the plate. Stiffness \(C\) is set per unit length (one meter) with a unit of bending moment divided by length unit [Nm/m]. The stiffness of one element \(C_i\) has a bending moment unit divided by length unit squared [Nm/m2] and is then:
\[ C_i = \frac{C}{s_d} \]
For a better understanding of the stiffness values, see the document European Recommendations on the Stabilization of Steel Structures by Sandwich Panels.
Hidden finite elements and RBE3 provide lateral and torsional stiffness to member plate
Note that RBE3 are only interpolation links that do not provide any stiffness on their own.
Verification
A model providing LTR was verified by LTBeam software, which uses bar (1D) elements with seven degrees of freedom. That means the cross-section is not deformed, but the element can capture warping. The comparison is shown on an example of IPE 180 cross-section from steel grade S355 with a length of 6 m. The beam is fixed at both ends with a uniform load of 20 kN/m applied at the top flange. Software LTBeam is able to determine the elastic critical moment that corresponds to the result of linear buckling analysis (LBA) in IDEA StatiCa Member.
Comparison of LTBeam and IDEA StatiCa Member for lateral and torsional stiffness
The critical load multiplier to elastic buckling \(\alpha_{cr}\) with lateral stiffness is very similar according to both software. The limit lateral stiffness where lateral-torsional buckling has an effect up to only 5 % of beam bending resistance is calculated according to EN 1993-1-1 as Slim = 8 589 kN. However, the results with torsional restraint are diverging at higher levels of rotational stiffness. Observing the deformed shape in IDEA StatiCa Member, the difference is caused by the cross-section deformation that can be captured only by the shell model. LTBeam provides unrealistically high critical load multipliers for high torsional stiffness.
To verify this claim, the ABAQUS shell element model was created at ETH university. The beam is again fixed on both ends, made of steel grade S355 and with a length of 6 m. Beam cross-section IPE 240 was used. Limit torsional stiffness, i.e. lateral-torsional buckling has an effect up to only 5 % of beam bending resistance, was calculated as Clim = 27.13 kNm/m. The model is loaded by force in the mid-span at the top flange.
Comparison of ABAQUS, LTBeam, and IDEA StatiCa Member for torsional stiffness
The effect of torsional stiffness is very similar in both models made of shell elements and LTBeam diverges. Most importantly, ABAQUS and IDEA StatiCa Member buckling resistances provided by GMNIA almost coincide – the differences are up to 4 %.
Stiffness estimation
LTR provided by floors filled with concrete and with composite action provided by shear studs may be assumed as rigid at least in the case of lateral stiffness. The stiffnesses provided by trapezoidal sheets of sandwich panels are much smaller and may be determined by experiments or calculations. Most often, the values of lateral and torsional stiffness would be recommended by manufacturers of sandwich panels or other types of cladding.
The calculation of lateral stiffness S [N] provided by trapezoidal sheets is provided in EN 1993-1-3, Chapter 10:
\[S=1000 \sqrt{t^3} \left ( 50+10 \sqrt[3]{b_{roof}} \right ) \frac{s}{h_w} \]
where:
- t – design thickness of trapezoidal sheeting [mm]
- broof – roof width, i.e. for gable roof it is the distance between a ridge and an eave [mm]
- s – distance between beams [mm]
- hw – trapezoidal sheet profile depth [mm]
The formula is valid if the trapezoidal sheet is connected to the beam at each rib. If the sheeting is connected to the beam at every second rib only, then S should be substituted by 0.2 S.
Lateral stiffness of sandwich panels is described in ECCS recommendation. The stiffness of fasteners is essential:
\[S=\frac{k_v}{2B} \sum_{k=1}^{n_k}c_k^2\]
where:
- kv – shear stiffness of a fastening
- B – width of a sandwich panel
- nk – number of pairs of fasteners per panel and support
- ck – distance between the two fasteners of a pair
Torsional stiffness is more complicated and can also be estimated by ECCS recommendation. It contains the contribution of fasteners, sandwich panel, and beam distortion. The beam distortion may be neglected because it is already included in the shell element model.
Torsional (on the left) and lateral stiffness (on the right) provided by sandwich panels (ECCS, 2014)
In American practice, restraint against lateral torsional buckling is typically assumed to be full or negligible based on the type and orientation of decking. For example, Table 8.1 of the AISC Seismic Design Manual identifies restraint conditions for beams subject to axial compression. However, where necessary, the lateral stiffness can be derived from the diaphragm stiffness, G’, computed in accordance with AISI S310. Denavit et al. (2020) present a method of calculating torsional stiffness.
References
- CTICM, LTBeam v. 1.0.11, available at: https://www.cesdb.com/ltbeam.html
- Abaqus. Reference manual, version 6.16. Simulia, Dassault Systéms. France, 2016.
- EN 1993-1-3: Eurocode 3: Design of steel structures – Part 1-3: General rules – Supplementary rules for cold-formed members and sheeting, CEN, 2006.
- ECCS TC7 – Technical Working Group TWG 7.9 Sandwich Panels and Related Structures, European Recommendations on the Stabilization of Steel Structures by Sandwich Panels, 2nd edition, 2014. ISBN 978-90-6363-081-2
- Denavit, M.D.; Jacobs, W.P.; Helwig, T.A. (2020). "Continuous Bracing Requirements for Constrained-Axis Torsional Buckling," Engineering Journal, American Institute of Steel Construction, Vol. 57, pp. 69-89.
Steel joints of hollow section cross-section members
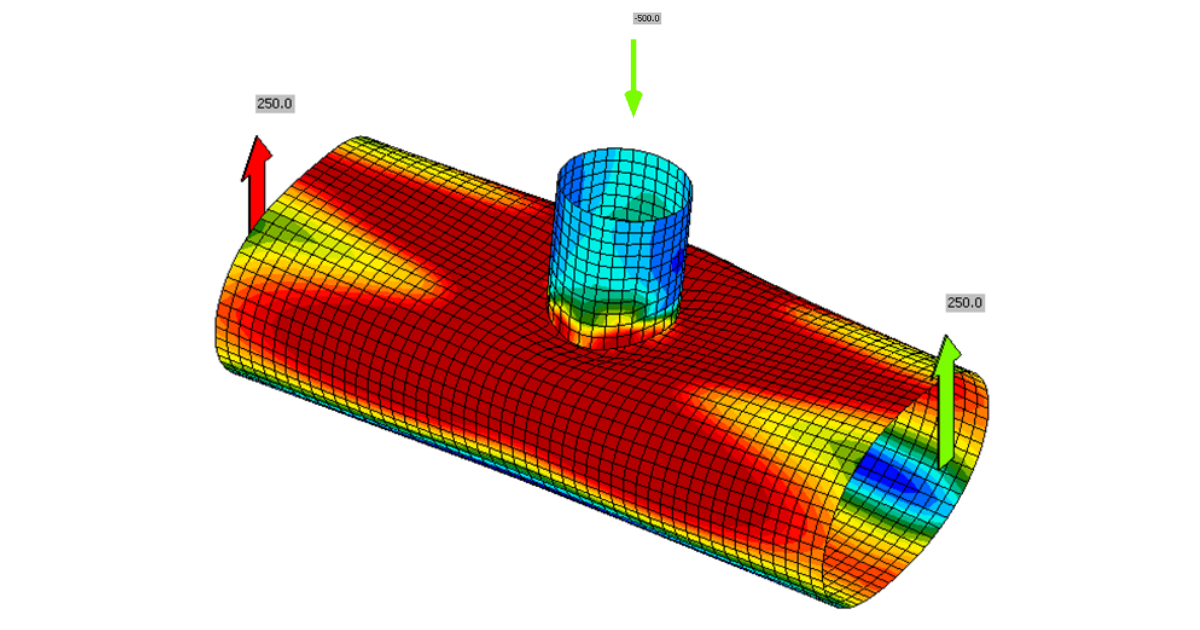
Joints of hollow section members may undergo serious deformations while able to carry still higher loads. On the other hand, the plates may buckle in inelastic range, for which purpose, geometrically and materially nonlinear analysis is implemented.
Out-of-plane deformation
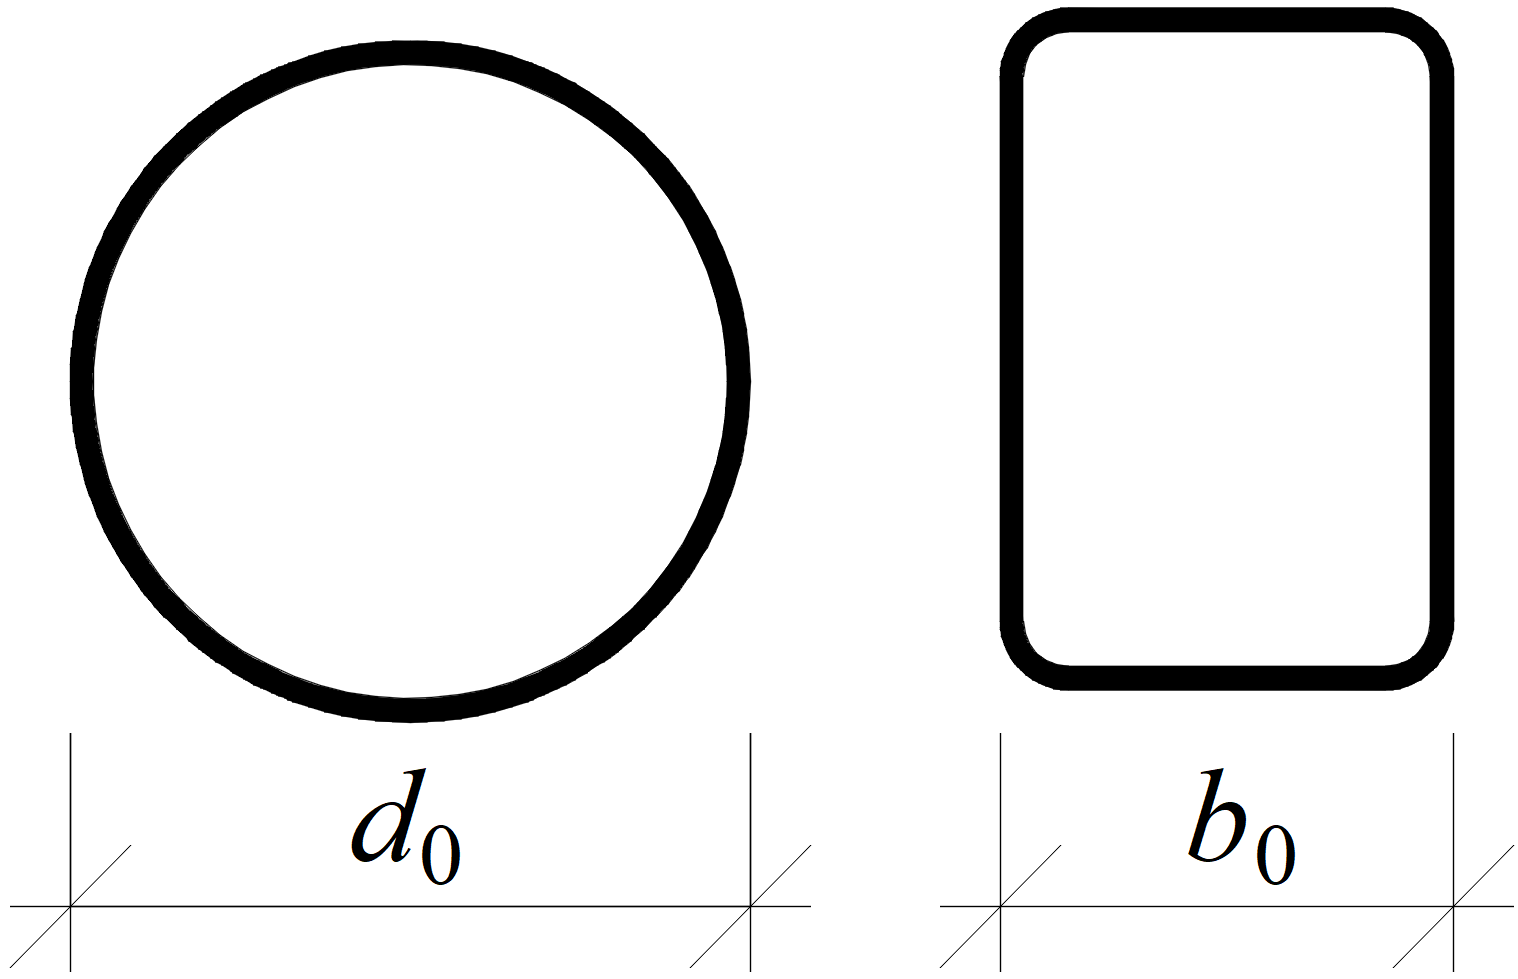
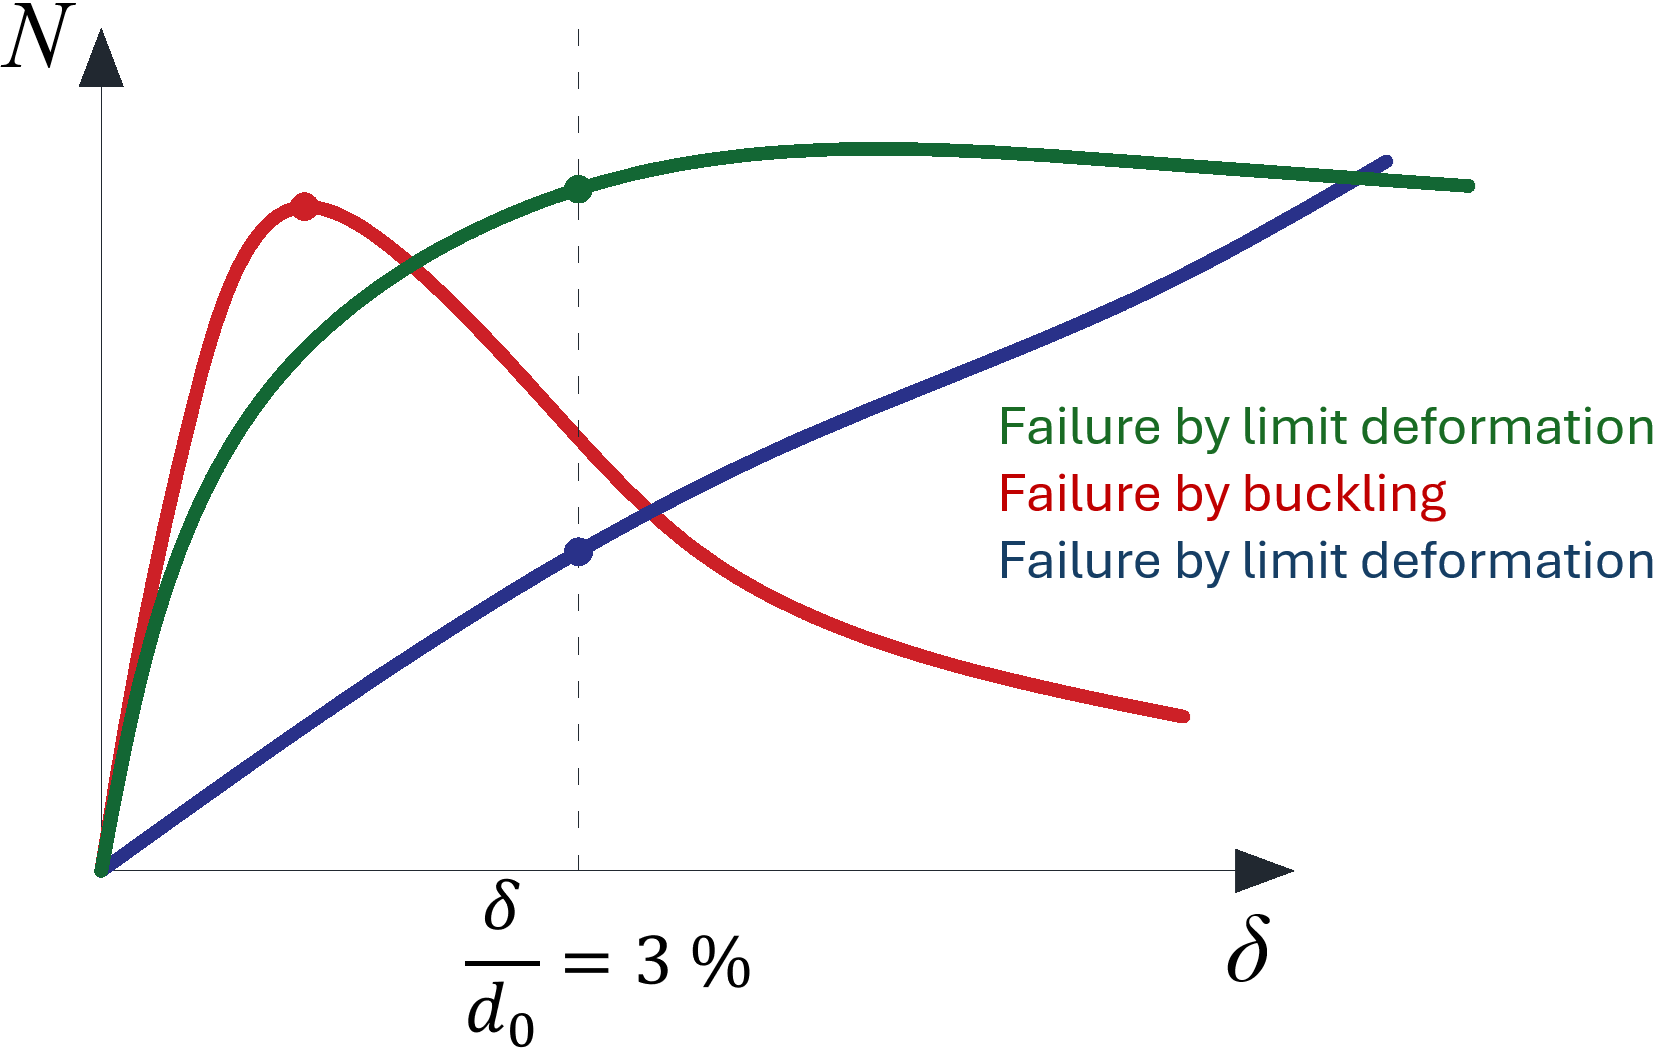
One of the criteria for the ultimate limit state of hollow section joints is the out-of-plane deformation of the hollow section cross-section. The check is available in the software (in Code Setup as Local deformation check, for hollow bearing members turned on by default). It is recognized by CIDECT design guides. The limits are 3 % of the smaller size of the cross-section (0.03 d0 for CHS and 0.03 b0 for RHS) for the ultimate limit state and 1 % for the serviceability limit state.
Definition of cross-section sizes for circular hollow section (CHS) and rectangular hollow section (RHS)
Typical load-deformation diagrams for hollow section joints; the red curve is for thin-walled member loaded in compression, the green curve for regular members loaded in compression, the blue curve is e.g. for X-joint loaded by tension
Geometrically and materially non-linear analysis (GMNA)
In the case of some joints of hollow sections, especially with high diameter to thickness ratio, the geometrically linear analysis may not capture the behavior of the joint with sufficient precision, and its load resistance may be underestimated or overestimated. It is recommended to use more advanced geometrically and materially nonlinear analysis for joints of hollow sections even though the computational time is slightly higher. If GMNA analysis for hollow sections is selected in Code setup, GMNA is used instead of geometrically linear and materially nonlinear analysis (MNA, used as a standard in IDEA Statica Connection) for models with hollow section member as a bearing member.
Note: If the bearing member is not a hollow section, the GMNA solver is disabled for the analysis of the whole connection model regardless of the settings in the code setup (GMNA on or off).
Cross-section deforms at the end of the shell model
The cross-section may deform at the ends of the model consisting of shell elements. Joints of hollow sections require relatively long members – up to 10 times cross-section diameter. Condensed superelement is placed behind the part of the model consisting of shell elements. This allows faster calculation with the same precision as the full model consisting of shell elements. The condensed superelement has only elastic material properties, and that means the plastic strains due to the investigated failure mode should not reach the end of shell element model. For this reason, the shell model spans by default 1.25 times the cross-section height (editable in Code setup) behind the last manufacturing operation.
Shell bending resistance reduced for hollow sections (imperfections)
Load resistances of hollow section joints in the codes are determined by the Failure Mode Method that uses curve-fitting models determined from experiments and advanced numerical models. The real structure contains initial imperfections and residual stresses, which are not captured by shell models in IDEA StatiCa Connection. To achieve closer compliance with the results of codes, the influence of residual stress and initial imperfections is simulated by reducing the bending resistance of shells of hollow sections with a high D/(2t) ratio.
Fatigue analysis type in structural design
The fatigue analysis type does not provide any final resistance or number of cycles the detail can take. It just provides inputs to further calculations according to codes.
Always, at least two load cases must be set. The first load case is the reference one. It is assumed as, e.g., a self-weight of the structure and can contain zero loads. The other load cases are simulating fatigue actions. The nominal normal and shear stress provided by IDEA StatiCa is the stress range between the fatigue action, e.g. LE2, and the reference load case.
For example, the shear stress at a certain location is 50 MPa in the Reference load case and 180 MPa in LE2. The shown nominal shear stress at this location is:
\[\tau = 180-50=130\, \textrm{MPa}\]
Note that there should be no yielding of plates due to fatigue actions, otherwise the stress ranges are distorted.
The stresses are available for:
- Bolts
- Welds
- Plates
Bolts
At bolts, the stresses are determined simply by dividing the force by the corresponding area:
- \(\sigma = F_t / A_s \)
- \(\tau = V / A \)
where:
- \(F_t\) – tensile force in the bolt
- \(A_s\) – tensile stress area of the bolt
- \(V\) – shear force in bolt; if there are multiple shear planes, the highest shear force is used
- \(A\) – area of the bolt resisting in shear; tensile stress area if threads are intercepted by the shear plane and gross cross-sectional area otherwise
Welds
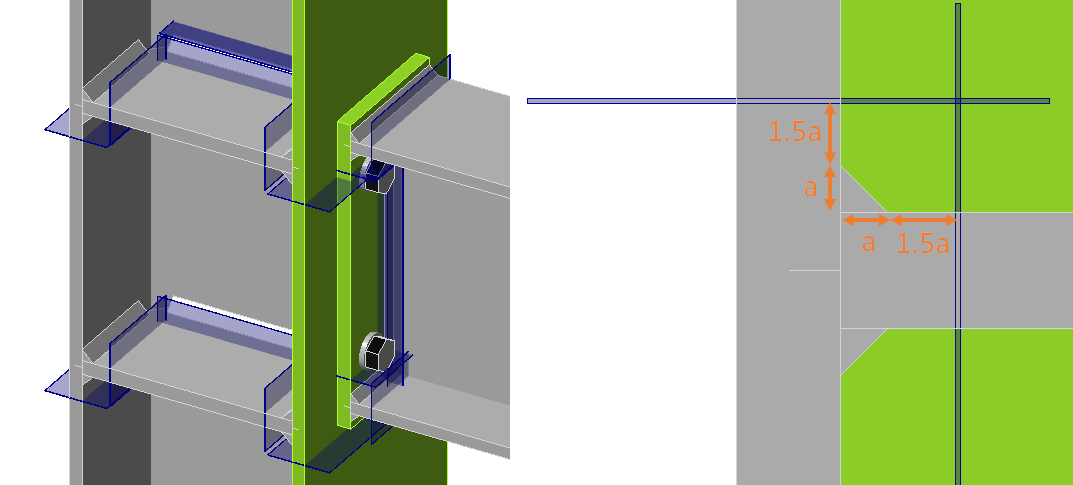
Welds in CBFEM consist of the weld element with multipoint constraints connecting the plates. The stress distribution in the weld is disrupted by the constraints and, therefore, the stresses are taken from a section located at 1.5 times the leg size from the weld toe. Three sections are created for a double-sided fillet weld. Two sections are in the same detail category, and only the more stressed one is shown. The maximum normal stress and the corresponding shear stress at the same location, as well as the maximum shear stress and the corresponding normal stress at the same location, are shown.
See also the fatigue analysis improvements in the 22.0 version.
Plates
The stress in plates may be visualized by creating a user-defined section by a Workplane manufacturing operation. In the figure below, two workplaces were created to see the stresses around bolt holes. The maximum normal stress and the corresponding shear stress at the same location, as well as the maximum shear stress and the corresponding normal stress at the same location, are shown.
Fire design
Temperature
In IDEA StatiCa Member, the user sets a temperature for the whole model. All entities in the model have a set temperature.
In IDEA StatiCa Connection, the user may set the temperature for each member or plate separately. The temperature of connecting elements - bolts and welds - is assumed to be according to the hottest connecting plate.
The temperature of members and plates in connections may be determined according to EN 1993-1-2 – Cl. 4.2.5 Steel temperature development and D.3 Temperature of joints in fire. The thermal properties of steel components are taken from EN 1993-1-2:
- Specific heat – Cl. 3.4.1.2
- Thermal conductivity – Cl. 3.4.1.3
Note that thermal elongation is not used in IDEA StatiCa Steel, because it would add forces that are greatly dependent on boundary conditions. Users are encouraged to add forces from the thermal expansion into the load effects themselves.
Material degradation
Material degradation of steel plates is available according to three codes:
- EN 1993-1-2 – Table 3.1
- AISC 360-16 – Table A-4.2.1
- CSA S16-14 – Table K.1
The multilinear material diagram is used for steel plates with six points according to EN 1993-1-2 – Figure 3.1. An example is shown for steel grade S355, material degradation according to EN 1993-1-2 – Table 3.1, and temperature \(\theta = 560^{\circ}\textrm{C}\). The slope of plastic branch past the yield strength \(f_y\) is \(E_{a,\theta}/1000\). The reduction factors for modulus of elasticity \(k_{E,\theta}\), for proportionality limit \(k_{p,\theta}\), and yield strength \(k_{y,\theta}\) are 0.426, 0.252, and 0.594, respectively. The plastic strain is assumed to build up since the proportionality limit.
| Strain | Plastic strain | Stress | |
| \(\varepsilon\) [%] | \(\varepsilon_{pl}\) [%] | \(\sigma\) [MPa] | |
| 0 | 0.00 | 0.00 | 0.0 |
| 1 | 0.10 | 0.00 | 89.5 |
| 2 | 0.25 | 0.15 | 131.4 |
| 3 | 0.50 | 0.40 | 160.5 |
| 4 | 1.00 | 0.90 | 191.3 |
| 5 | 2.00 | 1.90 | 210.9 |
| 6 | 15.00 | 14.90 | 222.5 |
Material degradation of bolts is available according to three codes:
- EN 1993-1-2 – Table D.1
- AISC 360-16 – Table A-4.2.3
- CSA S16-14 – Table K.3
Material degradation of welds is available according to one code:
- EN 1993-1-2 – Table D.1
Only the resistance of bolts and welds is reduced. Their stiffness remains the same as at ambient temperature.
Thermal expansion is neglected and not assumed in any models. If necessary, the effects of thermal expansion should be simulated by added loads.
Checks
Steel plates are checked for plastic strain 5% by default.
In Eurocode, a dedicated partial safety factor for Fire design, \(\gamma_{M,fi}\) is used for checks of bolts and welds. In all other codes, the standard resistance or safety factors are used. The load-deformation curves and checks of bolts and welds are reduced by factors \(k_b\) and \(k_f\) based on set temperature.
Preloaded bolts are assumed to slip and are checked as regular snug-tight bolts.
The temperature of the concrete block and anchors is unknown and corresponding components are not checked in Fire design.
Stiffness
Stiffness analysis is not available for Fire design at the moment. It is recommended to use stiffness analysis for ambient temperature and multiply the stiffness by reduction factor for modulus of elasticity \(k_{E,\theta}\).
Weld sizing
In IDEA StatiCa Connection, there are two strategies of weld sizing available to all users:
- to full-strength
- with over-strength
For Eurocode users, there are two more:
- to capacity estimation
- to minimum ductility
Weld sizing method is specified in Operations dialogue.
When running Weld sizing, every fillet weld in the model is modified according to weld sizing method. Generally, the size of welds will increase in this order:
- To capacity estimation
- To minimum ductility
- Full strength
- With over-strength
The methods are described in detail below.
To capacity estimation
Weld sizing to capacity estimation automatically provides weld sizes that are strong just enough to transfer set loads.
Weld capacity estimation is the first use of machine learning in IDEA StatiCa. At the moment, it is implemented only in Eurocode. Weld resistance is determined according to the most stressed weld element. Therefore, weld utilization is highly nonlinear. The resistance of the whole length is estimated by a machine-learning algorithm based on the stress distribution along the weld length.
Weld sizing to capacity estimation requires results. Size of fillet welds is adjusted according to the following formula:
\[ a_{new} = a \cdot Ut_c / Ut_{target} \]
where:
- \(a_{new}\) – adjusted fillet weld size
- \(a\) – previously set fillet weld size
- \(Ut_c\) – capacity estimation based on machine learning algorithm visible at Weld check
- \(Ut_{target}\) – target utilization in Settings → Design → Autodesign → Weld sizing
Resulting \(a_{new}\) is rounded up according to Preferences → Application units → New entity rounding → Weld size.
Note that weld sizes are limited by detailing rules, e.g. weld size cannot be smaller than 3 mm (EN 1993-1-8 – 4.5.2). These detailing rules are adhered to. Also, keep in mind that multiple welds in IDEA StatiCa are often set by one value. In these cases, the size is set according to the most utilized one.
Also, a calculation loop is available. When weld sizing method is set to capacity estimation, it:
- Sizes the fillet welds to full strength
- Calculates the model
- Sizes the fillet welds to capacity estimation
- Calculates the model
Welds are then set at or below target utilization with just one click.
To minimum ductility
Weld sizing to minimum ductility automatically provides welded connections that are strong enough to prevent brittle failures. The weld strength allows for the initial yielding of the plate, but ultimately, the weld ruptures.
The requirement for minimum ductility of welded joints in FprEN 1993-1-8:2023 – 6.9(4). It originates from Dutch national annex of EN 1993-1-8, where the fixed ratio of weld strength to plate strength is 0.8. It is also included in widely-used Green books from the UK, namely in Chapters C2 and C3. However, the fixed ratio is suitable only for steel grade S355. In the second generation Eurocode, this is expanded for all steel grades.
This requirement is checked for double-sided fillet welds by:
\[a/t=\frac{\beta_w\gamma_{M2} f_y}{\sqrt{2} f_u \gamma_{M0} } \cdot \min \left \{1.0, 1.1\frac{f_y}{f_u} \right \}\]
where:
- \(a\) – weld throat thickness
- \(t\) – thickness of the plate connected by edge
- \(\beta_w\) – weld correlation factor
- \(\gamma_{M2}\) – safety factor for bolts and welds; editable in Code setup
- \(f_y\) – plate yield strength
- \(f_u\) – weld ultimate strength
- \(\gamma_{M0}\) – safety factor for plates; editable in Code setup
The weld throat thickness for single-sided fillet weld is twice larger than that for double-sided fillet weld.
Note that the method is useful for transversely loaded welds and works if the plate is connected by its full width.
To full strength
Weld sizing to full strength automatically provides welds that are stronger than the connected plate. In the calculation, it is assumed that the plates are loaded in tension and welds transversely as the worst case for weld strength and ductility. This design is useful to avoid brittle failures of welds for static loading.
This approach is also included in widely-used Green books from the UK, namely in Chapter C1.
This requirement is checked for double-sided fillet welds by:
\[a/t=\frac{\beta_w\gamma_{M2} f_y}{\sqrt{2} f_u \gamma_{M0} }\]
where:
- \(a\) – weld throat thickness
- \(t\) – thickness of the plate connected by edge
- \(\beta_w\) – weld correlation factor
- \(\gamma_{M2}\) – safety factor for bolts and welds; editable in Code setup
- \(f_y\) – plate yield strength
- \(f_u\) – weld ultimate strength
- \(\gamma_{M0}\) – safety factor for plates; editable in Code setup
Note that the method is useful for transversely loaded welds and works if the plate is connected by its full width.
With overstrength
Weld sizing with overstrength automatically provides welds that are much stronger than the connected plate. Overstrength factor is specified Settings → Design → Autodesign → Weld sizing. The default value of 1.4 is taken from EN 1993-1-8 – 6.2.3 (5) to form a plastic hinge.
In the calculation, it is assumed that the plates are loaded in tension and welds transversely as the worst case for weld strength and ductility. This design is useful to avoid brittle failures of welds for plastic design or cyclic loading. Note that the large weld size automatically does not guarantee high ductility. On the opposite, it may lead to excessive residual stresses and deformations caused by weld shrinkage.
This requirement is checked for double-sided fillet welds by:
\[a/t=\frac{\beta_w\gamma_{M2} f_y}{\sqrt{2} f_u \gamma_{M0} } \cdot f_{overstrength}\]
where:
- \(a\) – weld throat thickness
- \(t\) – thickness of the plate connected by edge
- \(\beta_w\) – weld correlation factor
- \(\gamma_{M2}\) – safety factor for bolts and welds; editable in Code setup
- \(f_y\) – plate yield strength
- \(f_u\) – weld ultimate strength
- \(\gamma_{M0}\) – safety factor for plates; editable in Code setup
- \(f_{overstrength}\) – overstrength factor specified in Settings → Design → Autodesign → Weld sizing
Note that the method is useful for transversely loaded welds and works if the plate is connected by its full width.


