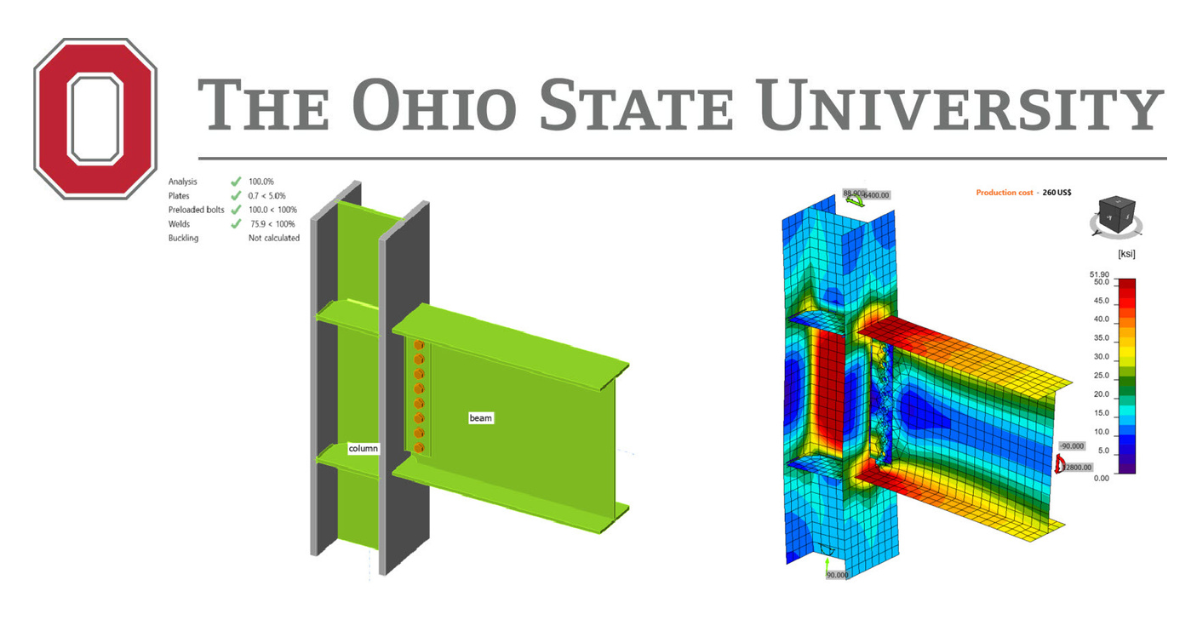
Welded Unreinforced Flange-Bolted Web (WUF-B) Prequalified Connection - AISC
This verification example was prepared in a joint project between Ohio State University and IDEA StatiCa. The authors are listed below:
- Baris Kasapoglu, Ph.D. student
- Ali Nassiri, Ph.D.
- Halil Sezen, Ph.D.
4.1. Introduction
Differently from the other moment connections covered in this study, welded unreinforced flange-bolted web (WUF-B) moment connection is permitted to be used only in ordinary moment frame (OMF) system. In this study, five tested and three developed WUF-B connections were investigated. Using IDEA StatiCa and following the AISC design procedure, flexural capacities of the eight connections were calculated, and the results were compared. One of the tested specimens was selected as a baseline model for the further investigation through Abaqus. Moment rotation curve was computed for the baseline model using both IDEA StatiCa and Abaqus, and the calculated curves were compared with the measured one presented in the test report. In addition, the effect of different bolt types was investigated in detail.
4.2 Experimental Study
Seven identical WUF-B moment connection pairs were assessed in accordance with the SAC Phase 2 Testing Protocol (SAC, 1997) by Lee et al. (1999) at Lehigh University as part of the SAC Phase II program. Five tested specimens were selected to be investigated in this study while one of them was chosen as a baseline model. The properties of the specimens are presented in Table 4.1. Baseline model consists of W24x68 beam and W14x120 column, six A325 slip critical (SC) bolts with a diameter of 7/8 in., 3/8-in.-thick shear plate, and 5/8-in.-thick continuity plate. Variation 1, variation 2, and variation 3 have identical beam W30x99, shear tab with a thickness of 1/2 in., continuity plate with a thickness of 3/4 in., and eight A325 slip critical (SC) bolts with a diameter of 1 in. whereas the sizes of columns are W14x145, W14x176, and W14x257, respectively. Variation 4 has W36x150 beam and W14x257 column, ten 1-in. diameter A325 bearing with threads excluded from shear planes, 5/8-in.-thick shear plate, and 1-in.-thick continuity plate.
Table 4.1: Properties of the WUF-B specimens (Lee et al., 1999)
| Specimen no (Test ID) | Beam size | Column size | Shear tab | Bolts | Continuity plate thickness |
| Baseline (3.1) | W24x68 | W14x120 | 18"x5"x3/8" | 6×7/8-in. A325 SC | 5/8 in. |
| Variation 1 (4.1) | W30x99 | W14x145 | 24"x5"x1/2" | 8×1-in. A325 SC | 3/4 in. |
| Variation 2 (5.1) | W30x99 | W14x176 | 24"x5"x1/2" | 8×1-in. A325 SC | 3/4 in. |
| Variation 3 (6.1) | W30x99 | W14x257 | 24"x5"x1/2" | 8×1-in. A325 SC | 3/4 in. |
| Variation 4 (7.1) | W36x150 | W14x257 | 30"x5"x5/8" | 10-1-in. A325 X | 1 in. |
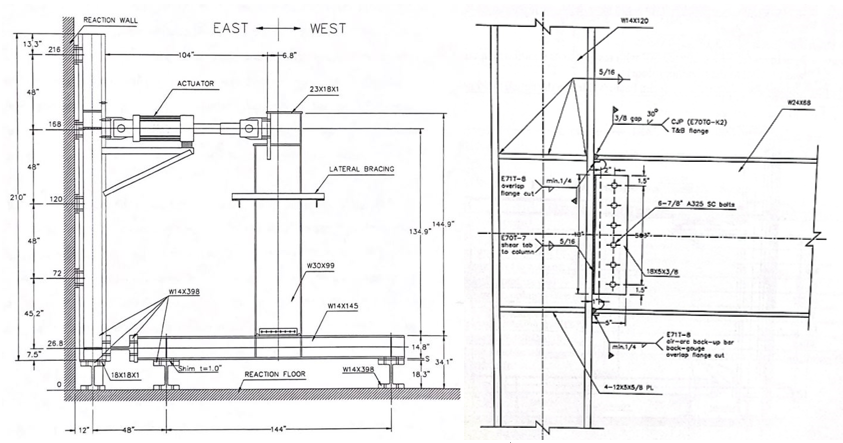
The length between the column supports is 144 in., and the distance from the column face to actuator is 134.9 in. The test setup and configurations of the five connections are presented in Figures 4.1 through 4.3.
Figure 4.1: Left) Test setup; Right) configuration of baseline (Lee et al., 1999)
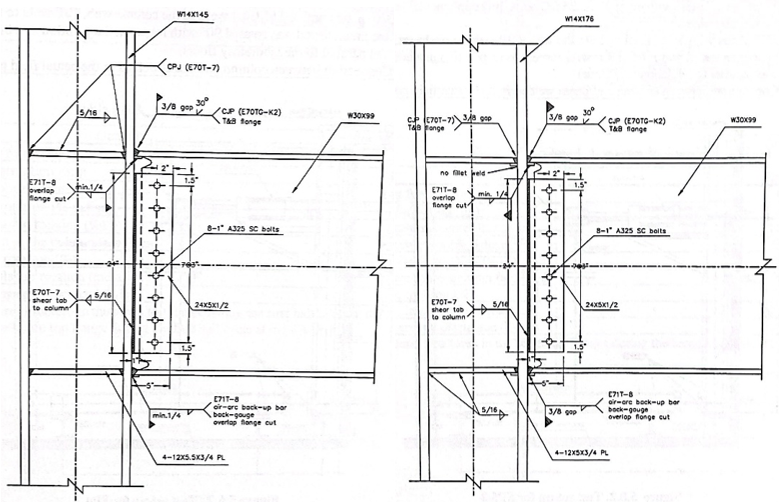
Figure 4.2: Left) Configuration of variation 1; Right) configuration of variation 2 (Lee et al., 1999)
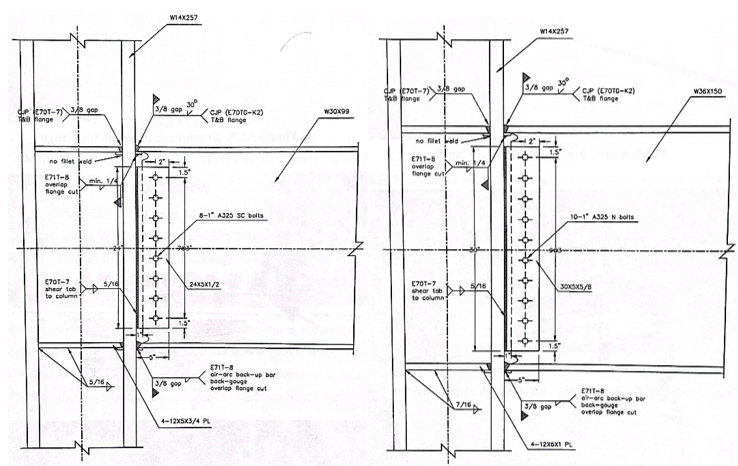
Figure 4.3: Left) Configuration of variation 3; Right) configuration of variation 4 (Lee et al., 1999)
The coupon test material properties for the beam flange, column flange, shear plate, and continuity plate are presented in Table 4.2.
Table 4.2: Measured material properties of selected WUF-B specimens (Lee et al., 1999)
| Specimen no (Test ID) | Member | Yield stress (ksi) | Ultimate strength (ksi) |
| Baseline (3.1) | Beam | 45.4 | 67.4 |
| Column | 46.0 | 67.6 | |
| Shear plate | 46.6 | 70.4 | |
| Continuity plate | 51.6 | 73.4 | |
| Variation 1 (4.1) | Beam | 51.2 | 69.8 |
| Column | 47.7 | 69.0 | |
| Shear plate | 41.6 | 64.3 | |
| Continuity plate | 43.5 | 64.0 | |
| Variation 2 (5.1) | Beam | 51.2 | 69.8 |
| Column | 51.9 | 73.6 | |
| Shear plate | 41.6 | 64.3 | |
| Continuity plate | 43.5 | 64.0 | |
| Variation 3 (6.1) | Beam | 49.8 | 68.9 |
| Column | 48.8 | 72.9 | |
| Shear plate | 41.6 | 64.3 | |
| Continuity plate | 43.5 | 64.0 | |
| Variation 4 (7.1) | Beam | 41.8 | 63.6 |
| Column | 48.3 | 70.6 | |
| Shear plate | 51.6 | 73.4 | |
| Continuity plate | 44.7 | 68.5 |
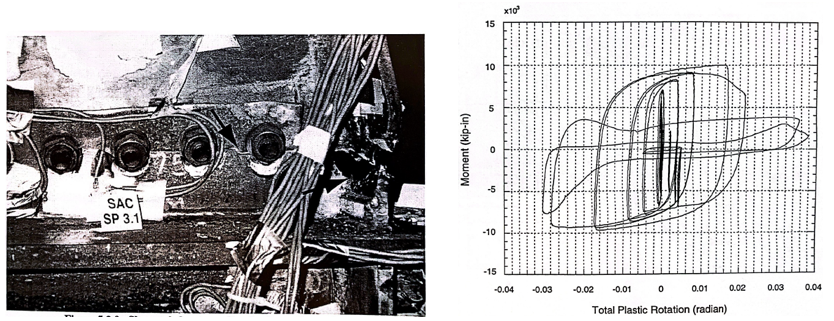
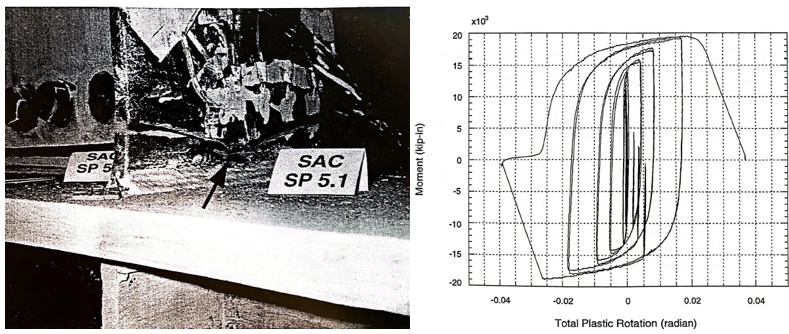
According to the experimental tests, the panel zone of the baseline model started to yield at 0.75% drift cycles. Yielding in the beam flanges started at 1% drift cycles, and tearing out of the beam flange was observed at the second cycle at 3% drift (see Figure 4.4). Similarly, the first shear yielding was observed in the panel zone of variation 1 at 0.5 drift cycles. The yielding in the panel zone was spread out during 1.5 drift cycles. During 3% drift cycles, plastic hinge occurred in this zone and fracture in the column k-zone was observed (see Figure 4.5). Regarding variation 2, it was reported that the panel zone started to yield at 1% drift cycles, and it spread out during further cycles. During 2% drift cycles, the beam flanges yielded. Small crack occurred in the beam flanges at 3% drift cycles and fracture was observed in the beam top flange at the first cycle of 4% drift (see Figure 4.6).
Figure 4.4: Left) Baseline model after testing; Right) moment-total plastic rotation relationship (Lee et al., 1999)
Figure 4.5: Left) Variation 1 after testing; Right) moment-total plastic rotation relationship (Lee et al., 1999)
Figure 4.6: Left) Variation 2 after testing; Right) moment-total plastic rotation relationship (Lee et al., 1999)
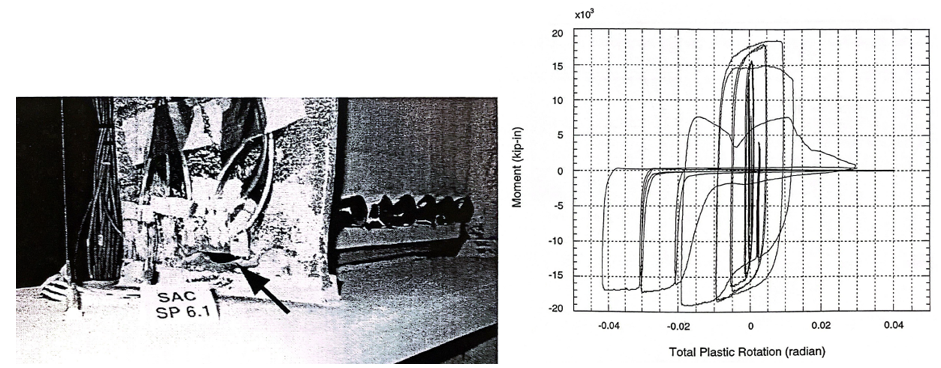
Differently from the first three test specimens, the first yielding formed in the beam flanges during 1% drift cycles, and small cracks in this area were observed at 1.5 drift cycles during the test of variation 3. The panel zone started yielding during 2% drift cycles and ductile tearing was observed in the beam top flange at 2% drift cycles (see Figure 4.7).
Figure 4.7: Left) Variation 3 after testing; Right) moment-total plastic rotation relationship (Lee et al., 1999)
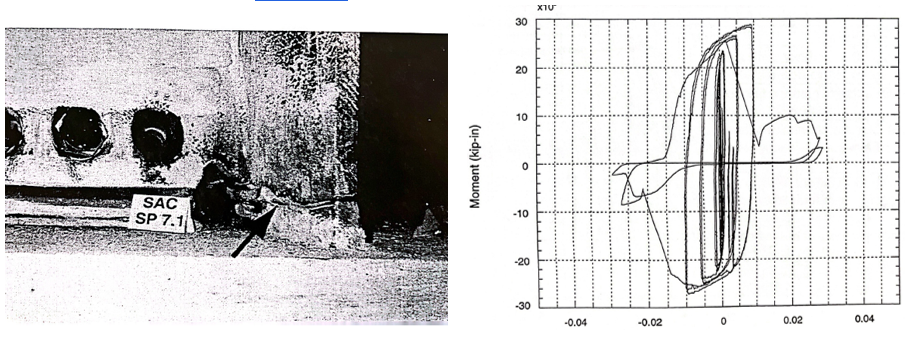
For variation 4, it was stated in the test report that first yielding occurred in the panel zone at 0.75 drift cycles. The beam flanges yielded at 1% drift cycles, and small cracks were observed near the weld access hole of beam flanges at 2% drift cycles. Fracture in the beam flanges were observed during the 3% drift cycles (see Figure 4.8).
Figure 4.8: Left) Variation 4 after testing; Right) moment-total plastic rotation relationship (Lee et al., 1999)
4.3 Code Design Calculations
The code-based design checks were performed and failure modes were determined for WUF-W moment connections following the requirements of AISC 341 (2016) and AISC 360 (2016). According to Section D.2 in AISC 341, bolted connections with a minimum slip coefficient of 0.30 can be designed as pretensioned bearing joints. Since the pre-analysis of the tested specimens performed using IDEA StatiCa showed that the governing limit state is bolt strength of slip critical joints for the baseline model, variation 2, and variation 3, three additional variations were developed from those tested connections by switching the bolt types from slip critical (SC) to bearing type with threads excluded from the shear plane. The number of developed three specimens were named by adding “.X” to the initial names, which were presented in Table 4.2, (e.g., baseline model.X from baseline model) while the names of the tested three specimens were updated by adding “.SC” to their initial names (e.g., baseline model.SC from baseline model, see Table 4.3 for the updated names).
The following design checks were identified for WUF-B moment connections from AISC 341 (2016) and AISC 360 (2016).
- Weld access hole (AWS (2016) D1.8/D1.8M)
- Check column flexural strength (AISC 360 (2016), Eq. F2-1)
- Check panel zone shear strength (AISC 341 (2016), J10-11)
- Check continuity plate requirements (AISC 341 (2016), Sec. E3.6f)
- Check shear yielding on beam (AISC 360 (2016), Eq. J4-3)
- Check weld strength between shear tab and column (AISC 360 (2016), Eq. J4-2)
- Check bolt shear strength (AISC 360 (2016), Eq. J3-6a)
- Check beam flange to column flange (AISC 341 (2016), Sec E1.6)
- Weld access hole (AWS (2016) D1.8/D1.8M)
Since bolt strength of the test specimens was not measured and provided in the report, A325 slip critical bolts were assumed to have class A surfaces with slip coefficient of 0.3, and the nominal values given by AISC Table J3 were used for the nominal tensile strength (\(f_{nt} = 90\) \(ksi\)) and shear strength (\(f_{nv} = 68\) \(ksi\)) for A325 bearing type bolts. The summary of design cecks is presented in Table 4.3.
Table 4.3: Design checks for WUF-W moment connections
| AISC Design Checks | Baseline Model.SC | Variation 1 | Variation 2.SC | Variation 3.SC | Variation 4 | Baseline Model.X | Variation 2.X | Variation 3.X |
| Beam flexural strength | OK | OK | OK | OK | OK | OK | OK | OK |
| Column flexural strength | OK | OK | OK | OK | OK | OK | OK | OK |
| Bolt shear strength | Not OK | Not OK | Not OK | Not OK | OK | OK | OK | OK |
| Panel zone shear strength | Not OK | Not OK | OK | OK | OK | Not OK | OK | OK |
| Beam shear strength | OK | OK | OK | OK | OK | OK | OK | OK |
| Weld strength between shear tab and column | OK | OK | OK | OK | OK | OK | OK | OK |
| Beam flange to column flange connection | OK | OK | OK | OK | OK | OK | OK | OK |
| Continuity plate requirements | Not OK | Not OK | Not OK | Not OK | Not OK | Not OK | Not OK | Not OK |
| Access hole requirements | Not OK | Not OK | Not OK | Not OK | Not OK | Not OK | Not OK | Not OK |
Failure mode of the specimens can be predicted by calculating strength of the following limit states and determining the controlling one by comparing them with the required strength calculated from structural analysis that represents test setup condition:
- Plastic flexural strength of column
- Plastic flexural strength of beam
- Flexural strength corresponding to inelastic shear strength capacity of panel zone
Plastic moment strength of beam and column at plastic hinge location (\(M_{by@ph}\) and (\(M_{cy@ph}\)) are calculated as follows:
\(M_{b@ph}\) = \(F_{yb}Z_{bx}\) (4.1)
\(M_{b@ph}\) = \(F_{yc}Z_{cx}\) (4.2)
where \(F_{yb}\) is yield stress of beam, \(Z_{bx}\) is plastic section modulus of beam, \(F_{yc}\) is yield stress of column, and \(Z_{cx}\) is plastic section modulus of column. Inelastic panel zone shear strength, \(R_{npz}\), is calculated with an assumption that required axial strength of column is less than or equal to 75% of its axial yield strength in accordance with Section J10 in AISC 360 (2016) as follows:
\(R_{npz} = (1.0)(0.6)F_{yc}d_{c}t_{cw}(1+\frac{{3b_{cf}t_{cf}}^2}{d_{c}d_{b}t_{cw}})\) (4.3)
where \(d_{c}\) is column depth, \(t_{cw}\) is thickness of column web, \(b_{cf}\) is width of column flange, \(t_{cf}\) is thickness of column flange, \(d_{b}\) is beam depth.
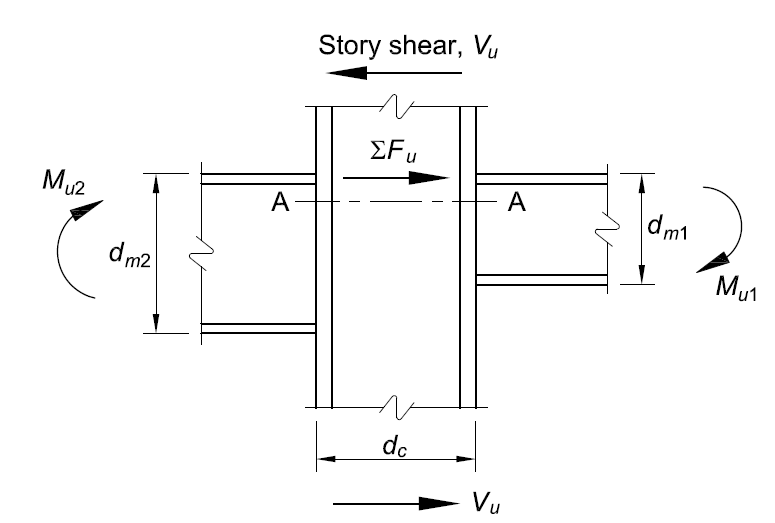
Flexural strength capacity of panel zone at column centerline, \(M_{npz}\), can be calculated by considering story shear of column acting in opposite direction as shown in Figure 4.9 as follows:
\(M_{npz} = (R_{npz} + V_{c})(d_{b} - t_{bf})\) (4.4)
where \(V_{c}\) is shear force of column, \(d_{b}\) is beam depth, \(t_{bf}\) is thickness of beam flange. Flexural strength capacity of panel zone at column face, \(M_{npz@foc}\), can be calculated by subtracting additional moment due to gravity load from column face to column centerline as follows:
\(M_{npz@foc} = M_{npz} - V_{grav}\frac{d_{c}}{2}\)
where \(V_{grav}\) is gravity force at the plastic hinge location of beam.
Figure 4.9: Forces in panel zone (AISC 360, 2016)
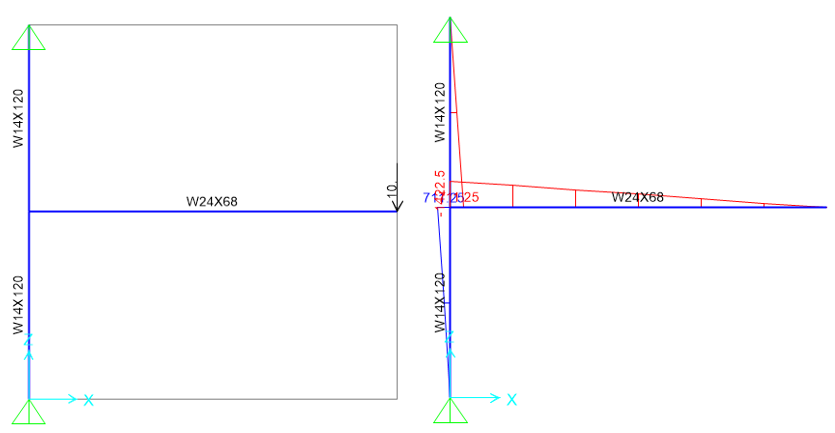
To calculate the response of specimens, SAP2000 model representing the test setup was developed. It is assumed that column supports are pin connections. For the baseline model, developed SAP2000 model and the calculated moment diagram corresponding to 10 kips vertical load at the beam end are illustrated in Figure 4.10.
Figure 4.10: Left) SAP2000 model; Right) Moment diagram
Moment responses of the beam and column at their centerlines (\(M_{bu@cc}\) and \(M_{cu@cc}\)) were obtained from SAP2000 model, and the corresponding moment values at the member faces (i.e., \(M_{bu@foc}\) and \(M_{cu@foc}\)) were calculated as follows:
\(M_{bu@foc} = (M_{bu@cc} - V_{ub})\frac{d_{b}}{2}\) (4.5)
\(M_{cu@foc} = (M_{cu@cc} - V_{uc})\frac{d_{c}}{2}\) (4.6)
where \(V_{ub}\) is calculated shear force of the beam and \(V_{uc}\) is calculated shear force of the column. It is assumed that the plastic hinge in the beam forms at the column face, and the plastic hinge in the column occurs in the beam face. Calculated flexural strength capacities of the panel zone and beam at the column face (i.e., \(M_{npz@foc}\) and \(M_{b@ph}\)), and the flexural strength capacity of the column at the beam face (\(M_{c@ph}\)) are presented in Table 4.4. Also, SAP2000 analysis was performed for each connection in a way that beam reaches its plastic moment strength capacity due to the applied shear force at the end of the beam which represents actuator. Calculated moment responses of the column and beam at the member faces (i.e.,\(M_{cu@foc}\), \(M_{bu@foc}\)) are also presented in Table 4.4. These values were compared with each other and the controlling limit state was determined.
Table 4.4: Summary of capacity calculations
| Specimen No | \(M_{b@ph}\) [kip-in] | \(M_{c@ph}\) [kip-in] | \(M_{npz@foc}\) [kip-in] | \(M_{bu@foc}\) [kip-in] | \(M_{cu@foc}\) [kip-in] | Controlling limit state [kip-in] |
| Baseline.SC | 8,036 | 9,752 | 7,410 | 8,036 | 3,537 | 7,410 |
| Variation 1 | 15,974 | 12,402 | 11,831 | 15,974 | 6,687 | 11,831 |
| Variation 2.SC | 15,974 | 16,608 | 16,676 | 15,974 | 6,697 | 15,974 |
| Variation 3.SC | 15,538 | 23,766 | 25,934 | 15,538 | 6,541 | 15,538 |
| Variation 4 | 24,286 | 23,522 | 30,938 | 24,286 | 9,670 | 24,286 |
| Baseline.X | 8,036 | 9,752 | 7,410 | 8,036 | 3,537 | 7,410 |
| Variation 2.X | 15,974 | 16,608 | 16,676 | 15,974 | 6,697 | 15,974 |
| Variation 3.X | 15,538 | 23,766 | 25,934 | 15,538 | 6,541 | 15,538 |
Failure modes of the baseline model.SC, variation 1, and baseline model.X are panel zone strength while plastic flexural strength of beam are governing limits for the rest of the specimens.
4.4 IDEA StatiCa Analysis
The eight WUF-B moment connections described in the previous section were modelled in IDEA StatiCa with the purpose of simulating the behavior of the experiments. The measured coupon test material properties provided in Lee et al. (1999) were used in the IDEA StatiCa software and the resistance factors were set to 1.0. Using the stress-strain analysis type in IDEA StatiCa (i.e., EPS), the moment capacities and failure modes of the connections were identified. For the baseline model, the moment-rotation relationship was calculated using the connection stiffness analysis type (i.e., ST) in IDEA StatiCa software.
4.4.1 Analysis of Baseline.SC Model
The IDEA StatiCa model was developed for the baseline.SC model using measured material properties (Table 4.2). The overstrength coefficients, \(R_{y}\) and \(F_{t}\), and all LRFD resistance factors were set to 1.0. To obtain the loads at the column centerline, a beam-column frame model was created in SAP2000 with the lengths of the column and beam in the test setup (See Figure 4.10). Pinned connections were assigned at both ends of column, and a shear force of 10 kips was applied at a distance of 134.9 in. away from the face of the column. The calculated nodal loads were applied to the IDEA StatiCa model at the beam position equal to zero (column centerline) by switching on the “loads in equilibrium” option. For the capacity calculation, the loads were gradually increased until any of the following is achieved:
- 5% plastic strain in plates (beam, column, shear tab, continuity plate)
- 100% strength capacity in bolts
- 100% strength capacity in welds
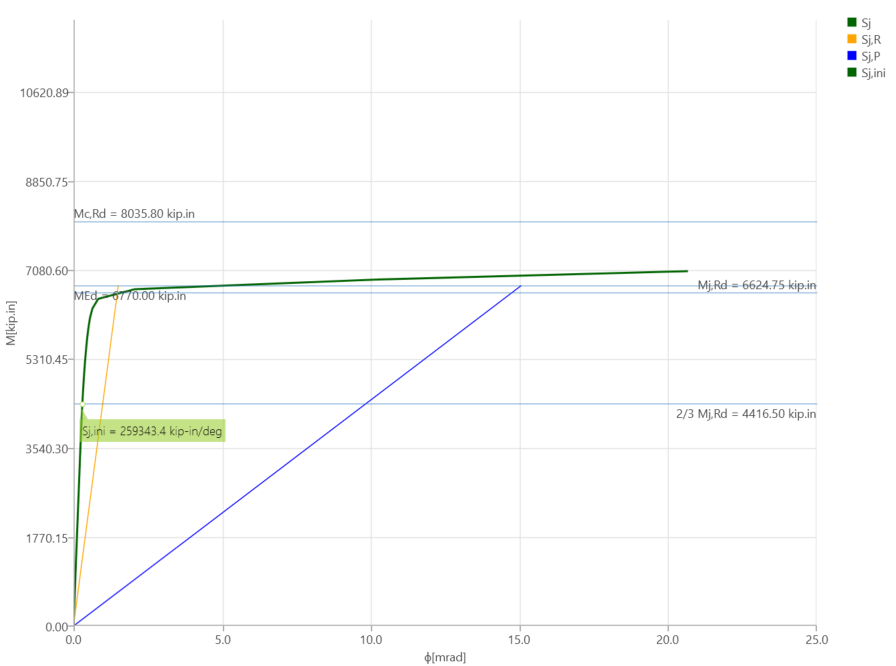
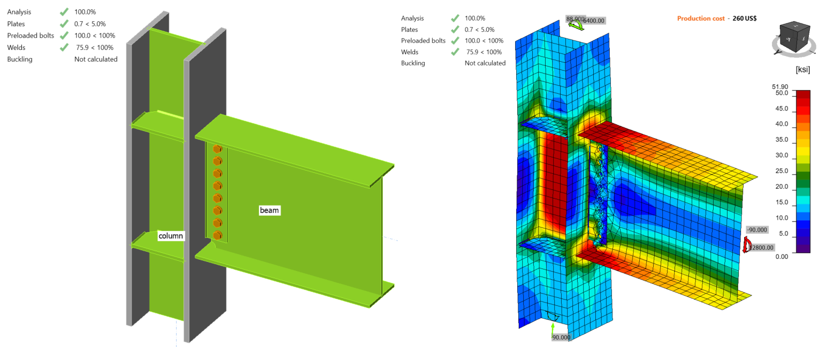
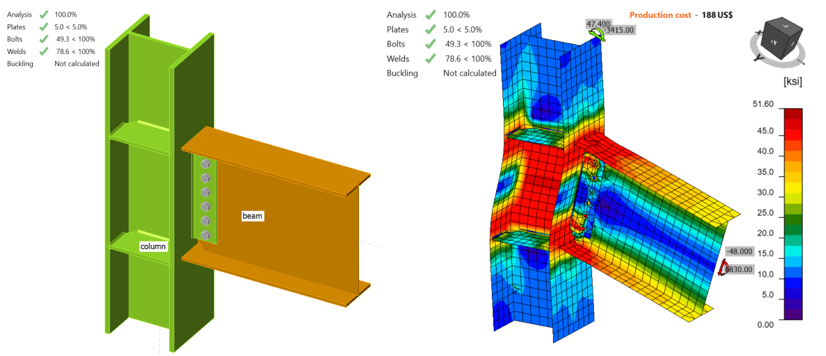
When the shear force and the corresponding moment values reached 47.60 kips and 6,770 kips-in., respectively, bolt strength capacity was achieved and the calculated average plastic strain in beam flanges is 3.2% (Figure 4.11). Using “ST” analysis, moment-rotation relationship was calculated and is shown in Figure 4.12. Note that in “ST” analysis, column is fixed at both ends, which may lead to differences between the bending resistance obtained by “EPS” analysis with loads in equilibrium.
Figure 4.11: IDEA StatiCa model for Baseline.SC model under the moment of 6,770 kips-in.
Figure 4.12: Moment-rotation relationship for baseline.SC model
4.4.2 Analysis of Variation 1
Following the same procedure described for the baseline.SC model, IDEA StatiCa model was developed for the variation 1 with slip-critical bolts. It was observed from the incremental loading that when the shear force and the corresponding moment were 82.20 kips and 11,700 kips-in., respectively, the beam web reached 5% plastic strain limit while 4.6% and 4.0% plastic strains were achieved in the beam flanges and column web, respectively (Figure 4.13).
Figure 4.13: IDEA StatiCa model for variation 1 under the moment of 11,700 kips-in.
4.4.3 Analysis of Variation 2.SC
Following the same procedure described in the previous two sections, IDEA StatiCa analysis was performed for variation 2.SC. It was observed that strength capacity of bolts was reached when the shear force and the corresponding moment were 90.0 kips and 12,800 kips-in., respectively (Figure 4.14).
Figure 4.14: IDEA StatiCa model for variation 2 under the moment of 12,800 kips-in.
4.4.4 Analysis of Variation 3.SC
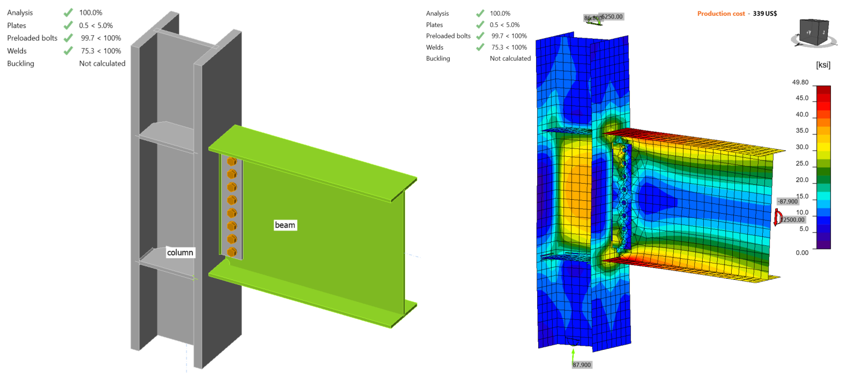
Following the same procedure, the flexural strength capacity of variation 3.SC was obtained using IDEA StatiCa. When the shear force and the corresponding moment reached 87.90 kips and 12,500 kip-in., respectively, strength capacity of the slip critical bolts was achieved (Figure 4.15).
Figure 4.15: IDEA StatiCa model for variation 3 under the moment of 12,500 kips-in.
4.4.5 Analysis of Variation 4
IDEA StatiCa analysis was performed for variation 4 following the same procedure. IDEA StatiCa analysis showed that 5% plastic strain limit was reached in the beam web and 3.8% plastic strain was calculated in the top flange of beam when the shear force of 156.60 kips and the corresponding moment of 22,270 kips-in. were reached (Figure 4.16).
Figure 4.16: IDEA StatiCa model for variation 4 under the moment of 22,270 kips-in.
4.4.6 Analysis of Baseline.X Model
IDEA StatiCa model for baseline model.X was developed from the baseline model.SC by changing the bolt types from slip critical to bearing bolts. The same procedure is followed, and the flexural capacity of the specimen was calculated. It was observed that 5% plastic strain was calculated in top flange of beam when shear force of 48.00 kips and the corresponding moment of 6,830 kip-in. were reached (see Figure 4.17). This is XX% higher than for Baseline.SC model.
Figure 4.17: IDEA StatiCa model for baseline.X model under the moment of 6,830 kips-in.
4.4.7 Analysis of Variation 2.X
IDEA StatiCa model for variation 2.X was developed from variation 2.SC by switching the bolt type. It was observed that 5% plastic strain was achieved in top beam web when the shear force of 97.00 kips and the corresponding moment of 13,800 kip-in. were applied (see Figure 4.18). Also, 4.8% plastic strain was calculated in the top flange of beam. This is XX% higher than for 2.SC model.
Figure 4.18: IDEA StatiCa model for variation 2.X model under the moment of 13,800 kips-in.
4.4.8 Analysis of Variation 3.X
IDEA StatiCa model for variation 3.X was developed from variation 3.SC by following the same steps explained in the previous two sections. It was observed that 5% plastic strain limit was achieved in the beam web while 4.9% plastic strain was calculated in the top flange of the beam when the shear force and the corresponding moment reached 98.20 kips and 13,970 kip-in., respectively (see Figure 4.19). This is XX% higher than for 3.SC model.
Figure 4.19: IDEA StatiCa model for variation 3.X under the moment of 13,970 kips-in.
Eight WUF-W moment connections were analyzed using IDEA StatiCa and their moment capacities at the column centerline were calculated. Moment capacities at the column face were calculated using Eq. 4.7 and are presented in Table 4.5.
\(M_{y@foc} = M_{y@cc} - V\frac{d_{c}}{2}\) (4.7)
where \(M_{y@foc}\) is moment capacity at the column face, \(M_{y@cc}\) is moment capacity at the column centerline, \(V\) is shear force, and \(d_{c}\) is depth of column.
Table 4.5: Moment capacities calculated by IDEA StatiCa
| Specimen No | \(M_{y@cc}\) (kips-in.) | \(M_{y@foc}\) (kips-in.) |
| Baseline.SC | 6,770 | 6,425 |
| Variation 1 | 11,700 | 11,091 |
| Variation 2.SC | 12,800 | 12,116 |
| Variation 3.SC | 12,500 | 11,779 |
| Variation 4 | 22,270 | 20,986 |
| Baseline.X | 6,830 | 6,482 |
| Variation 2.X | 13,800 | 13,063 |
| Variation 3.X | 13,970 | 13,165 |
4.5. ABAQUS Analysis
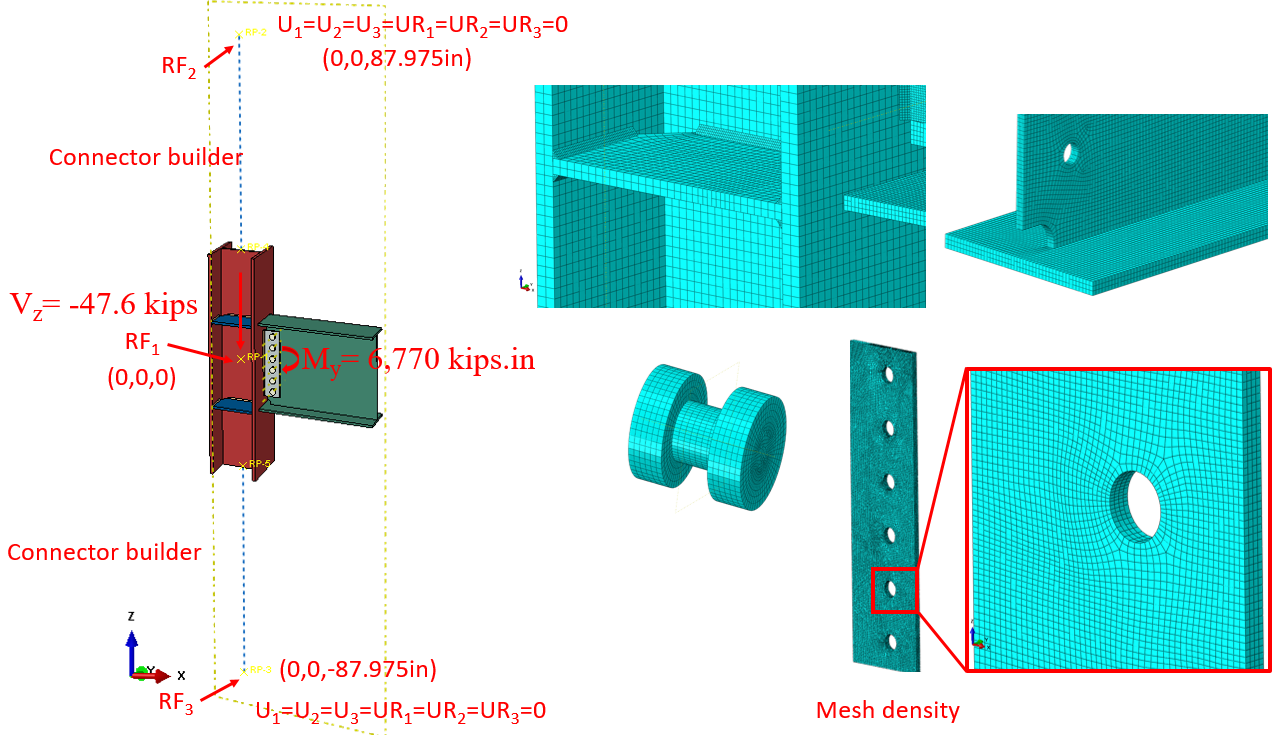
In this section, the baseline model developed in Section 4.4.1 was constructed again using ABAQUS software (version 2022) for FE analysis and results were compared with IDEA StatiCa. The CAD model for the FE analysis was generated using the IDEA StatiCa’s viewer platform. The six bolts and 28 weld lines that connected the entire assembly were then added manually using the CAD interface in ABAQUS. The vertical load of 47.6 kips and the corresponding moment of 6,770 kips-in. (around Y axis) were applied to a defined reference point (i.e., RF1) at the column centerline as shown in Figure 4.20. The analytical length of the column in IDEA StatiCa is 175.95 in. Therefore, to mimic the identical column length in ABAQUS, two other reference points (i.e., RF2 and RF3) were introduced 87.975 in. away from the center of the column along the Z axis in both directions (see Figure 4.20). These two reference points were fixed in all directions and were connected to the top and bottom faces of the column using the connector builder module in ABAQUS. To replicate the friction type shear force transfer in bolts in IDEA StatiCa, pretention load was applied in ABAQUS along the axis of each bolt shank. In ABAQUS, the element size was chosen to be between 0.1-0.4 in. after routine mesh sensitivity analysis, and a total of 310,451 elements were generated in the model. The 3D stress, 8-node linear brick reduced integration (i.e., C3D8R) was selected as element type.
Figure 4.20: Model setup and mesh density in ABAQUS
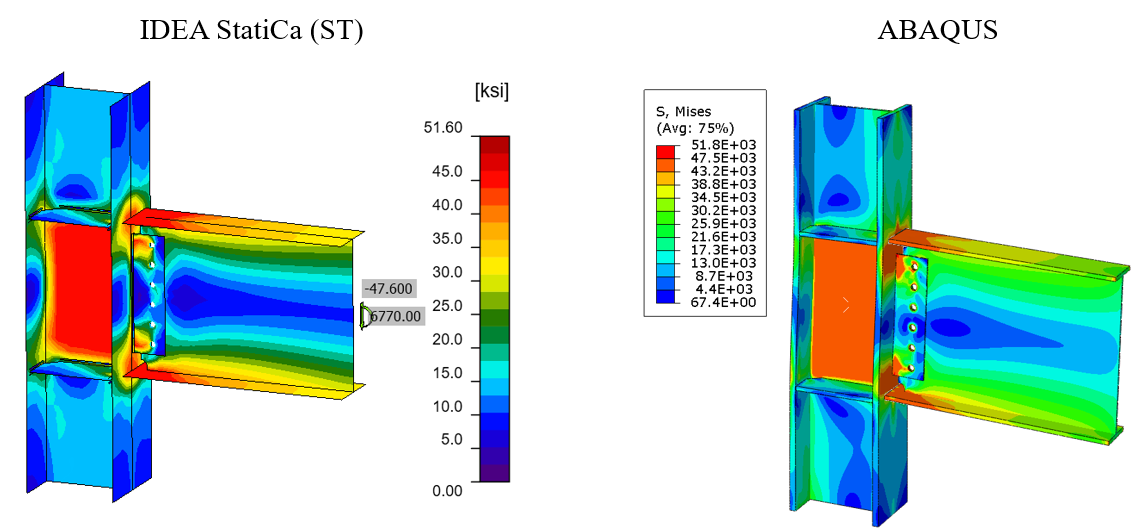
The tie constraint was applied between the weld lines and the attaching parts. The material behavior was modeled using bi-linear plasticity in ABAQUS. Other parameters, including density, elastic modulus, and Poisson’s ratio were taken from the IDEA StatiCa materials library. The numerical simulation was carried out on four processors (Intel Xenon ® CPU E5-2698 v4 @ 2.20GHz) and took approximately 270 minutes to finish. Figure 4.21 compares the predicted von-Mises stress between IDEA StatiCa and ABAQUS.
Figure 4.21: Comparison of the calculated von Mises stress between IDEA StatiCa and ABAQUS models
The maximum predicted stress in IDEA StatiCa was 46.2 ksi on the column web (note that the IDEA StatiCa legend shows the design data) while the ABAQUS model shows a maximum stress of 46.8 ksi at the same location. The maximum stress of 51.8 ksi in the ABAQUS legend belongs to the front weld line connecting the shear tab to the column. The slightly different stress distribution is likely due to the consideration of the length of the column in ABAQUS and the way that boundary conditions were applied, utilization of finer mesh in the FE analysis, and the simplified CAD model in IDEA StatiCa. Note that the authors performed a routine mesh sensitivity analysis for the IDEA StatiCa model and some inconsistencies in the results were observed.
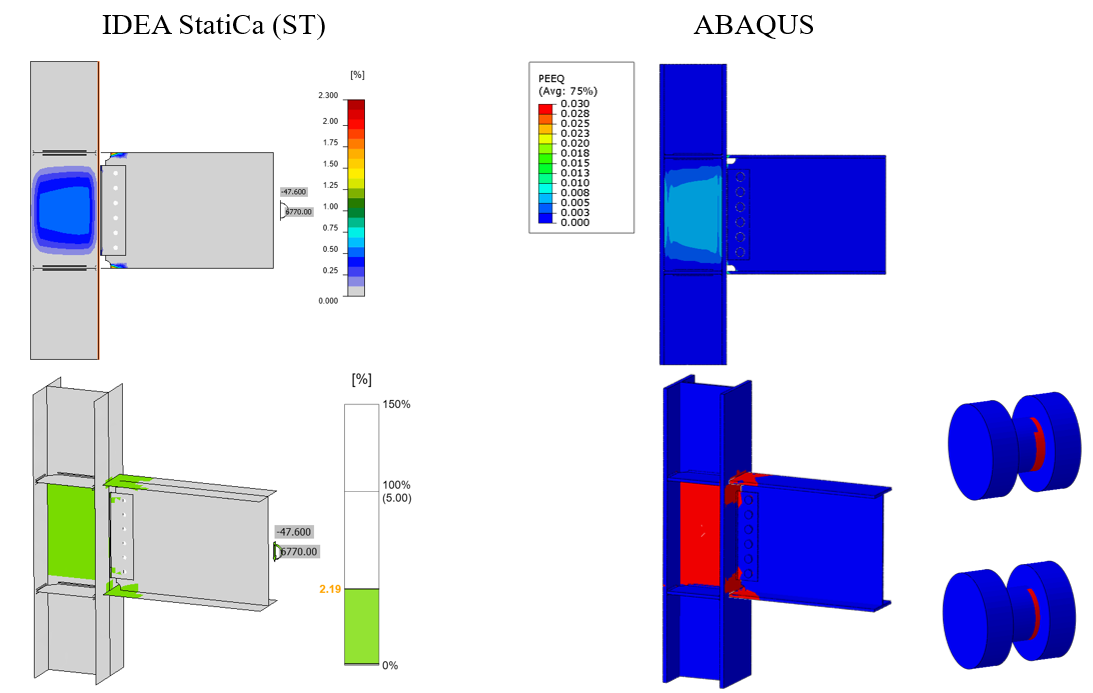
The maximum calculated plastic strain in IDEA StatiCa and ABAQUS were 2.3% and 2.9%, respectively (both on the top beam flange). Also, the predicted plastic deformation region by IDEA StatiCa was consistent with the calculated yield map in ABAQUS (i.e., the bottom row in Figure 4.22). In addition, the ABAQUS results show that bolts were also experiencing plastic deformation.
Figure 4.22: Top row) Comparison of the calculated plastic strain between IDEA StatiCa and ABAQUS models; bottom row) Comparison of the yield map between IDEA StatiCa and ABAQUS
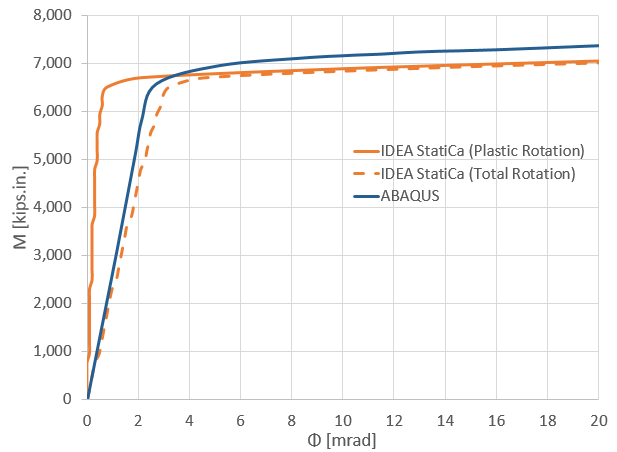
Figure 4.23 depicts the comparison of the moment-rotation curve between the two software with respect to the column centerline. Note that in Figure 4.23, to obtain the total rotation by IDEA StatiCa (shown by dashed orange line), the linear beam rotation at the column centerline was calculated using SAP2000 and then added to the default plastic rotation curve reported by IDEA StatiCa (shown by solid orange line). Both models offer comparable initial stiffness estimations. The minor discrepancy could be associated with the difference in the element types (i.e., solid element in ABAQUS versus shell element in IDEA StatiCa) and the employment of the tie constraint in ABAQUS to represent the welds.
Figure 4.23: Moment-rotation comparison between IDEA StatiCa and ABAQUS
4.6 Summary and Comparison of Results
The eight WUF-B moment connections were investigated using IDEA StatiCa and following the AISC design procedure. Also, the results from IDEA StatiCa baseline model (i.e., SC) were compared with those from the equivalent ABAQUS model.
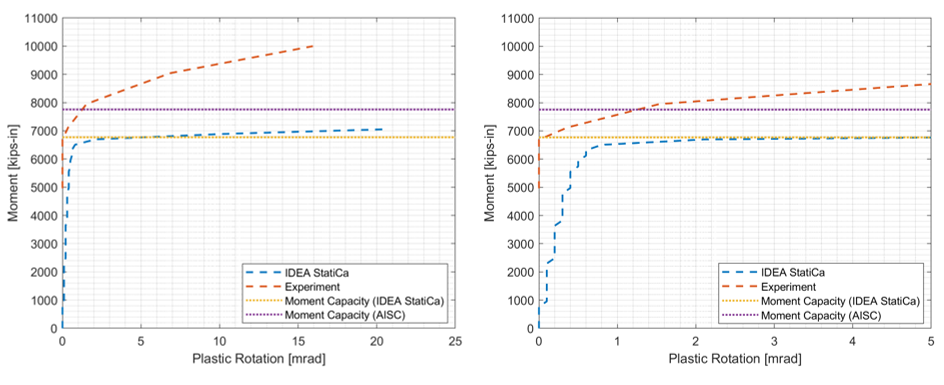
During the test of the baseline model.SC, the specimen failed due to tearing out of beam flange while the controlling limit state calculated from AISC procedure is panel zone strength which is 8% less than beam strength. IDEA StatiCa analysis for the baseline model.SC calculated the failure mode as bolt slip strength. On the other hand, IDEA StatiCa model of the baseline model.X failed due to the beam flange since the bolt type was changed to the bearing type from the slip critical as AISC 341 allows for the moment connections. Also, the calculated moment-plastic rotation relationship using IDEA StatiCa was compared with the curve provided in the test report as illustrated in Figure 4.24.
Figure 4.24: Moment rotation comparison for the baseline model.SC with a zoomed view on the right
For variation 1, it is indicated in the test report that plastic hinge occurred in the panel zone. The same failure mode was calculated from AISC procedure. On the other hand, IDEA StatiCa analysis showed that the specimen reached its capacity due to beam web with 5% plastic strain while 4% plastic strain was calculated in the panel zone.
Regarding variation 2.SC, fracture of the beam flange was reported as a failure mode of the specimen. Similarly, AISC procedure calculated the same failure mode. IDEA StatiCa model for variation 2.SC showed that the failure mode is bolt slip strength while IDEA StatiCa analysis performed for variation 2.X calculated the same failure mode with the test and AISC procedure.
For variation 3.SC, ductile tearing is reported during the experiment. The same failure mode was calculated following the AISC procedure. IDEA StatiCa model for variation 3.SC showed that the bolt slip strength was achieved while the one developed for variation 3.X showed that the specimen reached its capacity due to the flexural beam strength as observed by AISC procedure and during the experiment.
Regarding variation 4, the test observation, AISC procedure and IDEA StatiCa analysis calculated the same failure modes. The flexural moment capacity following IDEA StatiCa was computed as 20,656 kips-in. while it is calculated as 24,286 kips-in. using AISC procedure. The calculated flexural moment capacities of the eight specimens IDEA StatiCa and following AISC procedure are presented in Figure 4.25.
Figure 4.25: Moment capacities calculated by IDEA StatiCa and AISC procedure
Please add some comments at the end – e.g. IDEA StatiCa shows consistently safe results compared to experimental results and AISC procedures. Although slip-critical bolts are designed, they may be checked using bearing bolts in IDEA StatiCa, utilizing their post-slip bearing strength.
Read the full study on prequalified connections!
References
Lee, K. H., Stojadinovic, B., Goel, S. C., Margarian, A. G., Choi, J., Wongkaew, A., Reyher, B. P., and Lee, D. Y. (2002). Parametric Tests on Unreinforced Connections, Volume I-Final Report. SAC/BD-00/01.
AISC 360 (2016), “Specification for Structural Steel Buildings,” American Institute of Steel Construction ANSI/AISC 360-16, Chicago, Illinois.
AISC 341 (2016), “Seismic Provisions for Structural Steel Buildings,” American Institute of Steel Construction ANSI/AISC 341-16, Chicago, Illinois.
AWS D1.8/D1.8M (2016) Structural Welding Code—Seismic Supplement AWS B4.0:2007 Standard Methods for Mechanical Testing of Welds


